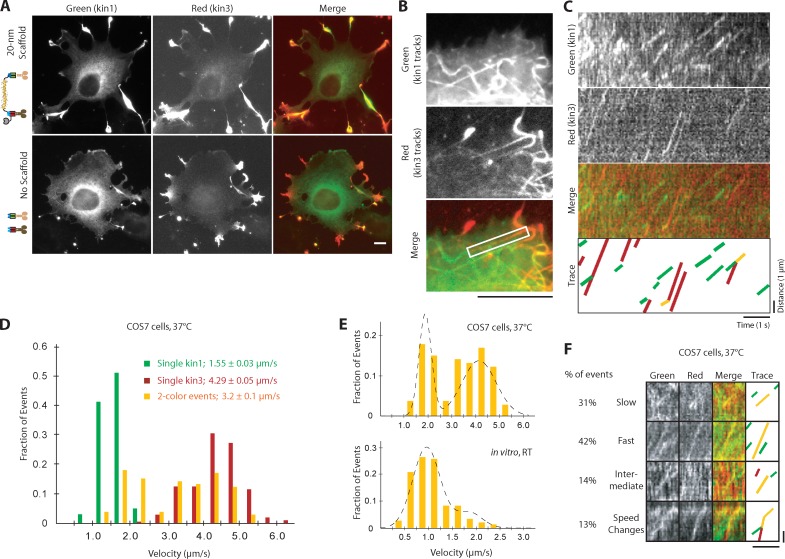
Figure 7.
Slow kinesin-1 and fast kinesin-3 motors in complex alternate their activities in COS7 cells. (A) Representative images of fixed COS7 cells expressing kin1-mNeGr (green) and kin3-2×mCh (red) in the presence or absence of scaffold. (B–F) COS7 cells expressing kin1-mNeGr, kin3-2×mCh, and a 20-nm scaffold were briefly treated with NZ (see Fig. S5 A) and imaged live by TIRF microscopy. (B and C) From the movie, a standard deviation map was generated (B) to visualize the motility tracks. The MT track in the white boxed region in B was used to generate kymographs (C) in each channel. (D) The velocities of kin1-mNeGr in the absence of scaffold (green bars, n = 102 events), kin3-2×mCh in the absence of scaffold (red, n = 210 events), and two-motor complexes (yellow, n = 106 events) were determined and are plotted as a histogram for each population. (E) The velocity distributions of kin1+kin3 complexes in COS7 cells at 37°C (top) compared with kin1+kin3 complexes in vitro at RT. The velocities show a clear bimodal distribution in COS7 cells, whereas the slow kin1 motor dominates in vitro. Broken lines were obtained by plotting the PDF of the sum of two Gaussians with the parameters obtained from the CDF fit (see Materials and Methods). n = 106 events in COS7 cells, n = 203 events in vitro; three independent experiments each. (F) Representative kymographs of the four types of behavior observed for kin1+kin3 complexes in live cells: slow, fast, intermediate, and speed change events. See Fig. S5 B for additional examples. Bars: (A and B) 10 µm; (C and F) 1 µm vertical, 1 s horizontal.

