Figure 1.
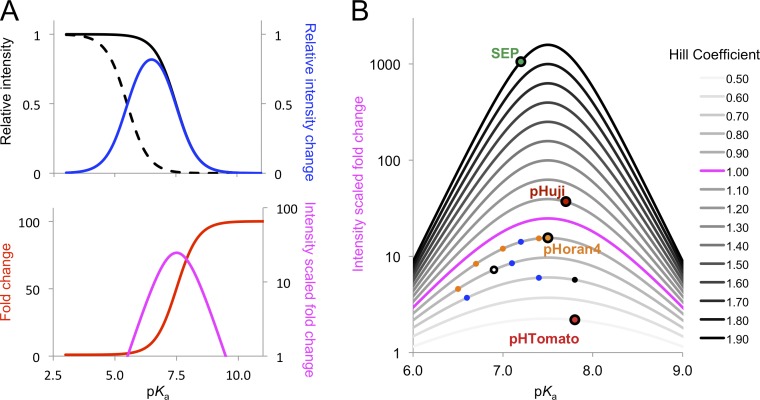
Theoretical optimization of pH sensor properties. (A) Theoretical calculation of optimal pKa for the largest fluorescence change from 5.5 to 7.5, with a nH of 1.0. Black solid line, relative fluorescence at pH 7.5 (F7.5/Fmax); black dashed line, relative fluorescence at pH 5.5 (F5.5/Fmax); red line, fluorescence fold change (F7.5/F5.5); blue line, relative fluorescence intensity change ((F7.5-F5.5)/Fmax); magenta line, intensity scaled fold change, which is the multiplication product of fold change and intensity change. (B) Effect of nH on the intensity scaled fold change at different pKa values. The pH-sensitive FPs covered in this work are mapped according to pKa and nH values. From top to bottom (nH descending), right to left (pKa descending): SEP; pHuji; pHoran4 (orange, same as mOrange and mOrange variants), pHoran3, A-17 (blue, same as mApple and mApple variants), pHoran2, and pHoran1; A-47, mNectarine (white), and mOrange; mCherry-TYG (black), A-9, and mApple; and pHTomato.

