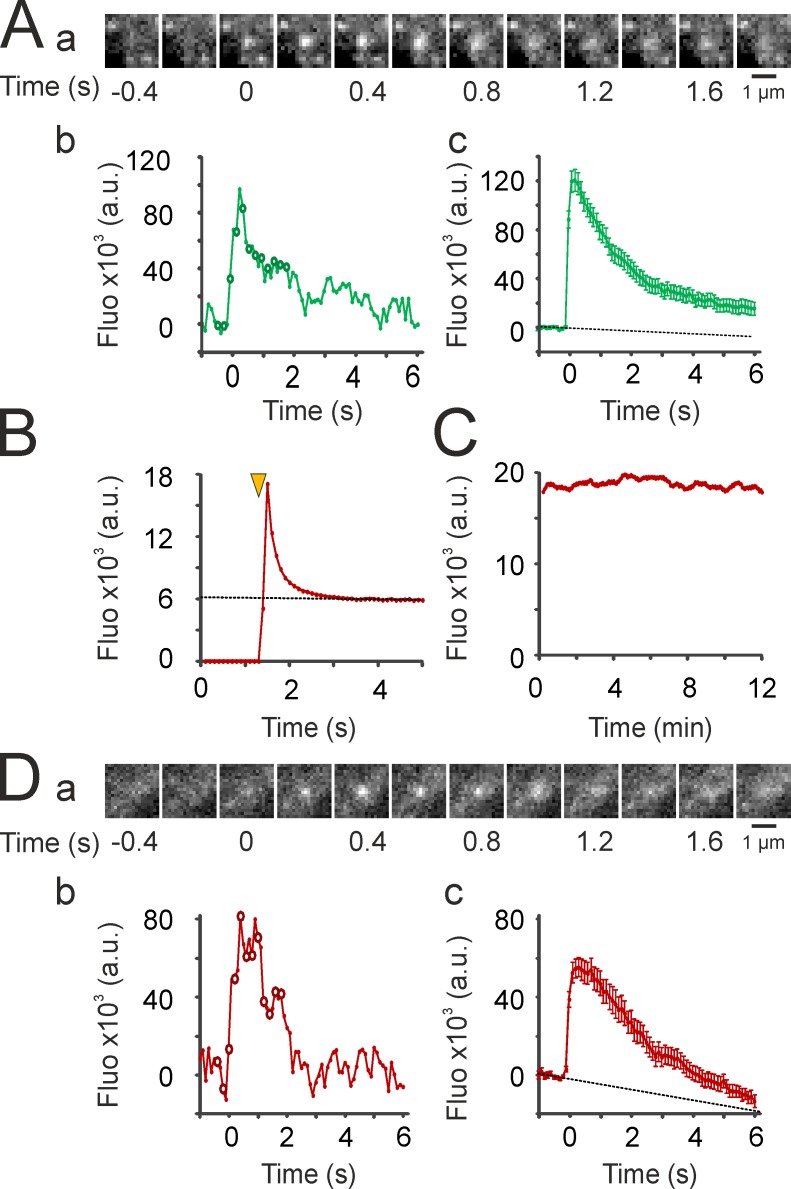
Figure 3.
Detection of exocytosis events with TfR-pHuji. (A) Detection of exocytosis events with TfR-SEP. (a) Example of an exocytosis event recorded at 10 Hz. (b) Quantification of the fluorescence of the event shown in panel a. A background image (average of five frames before the event) was subtracted before quantification. Circles correspond to images in panel a. (c) Mean of 56 events quantified as in panel b in three cells. Dotted line is an extrapolation of the linear fit of the nine data points before event detection to account for photobleaching. (B) Fluorescence of a representative cell (out of four recorded cells) expressing TfR-pHuji illuminated at the time marked by the yellow arrowhead and imaged continuously at 10 Hz. (C) Time-lapse recording of the same cell as in B (100-ms illumination, 0.25 Hz) similar to the ones used for imaging CCV formation. (D) Same as in A for exocytosis events detected in TfR-pHuji–expressing cells. (c) Mean fluorescence values for 40 events in three cells. Error bars represent SEM.

