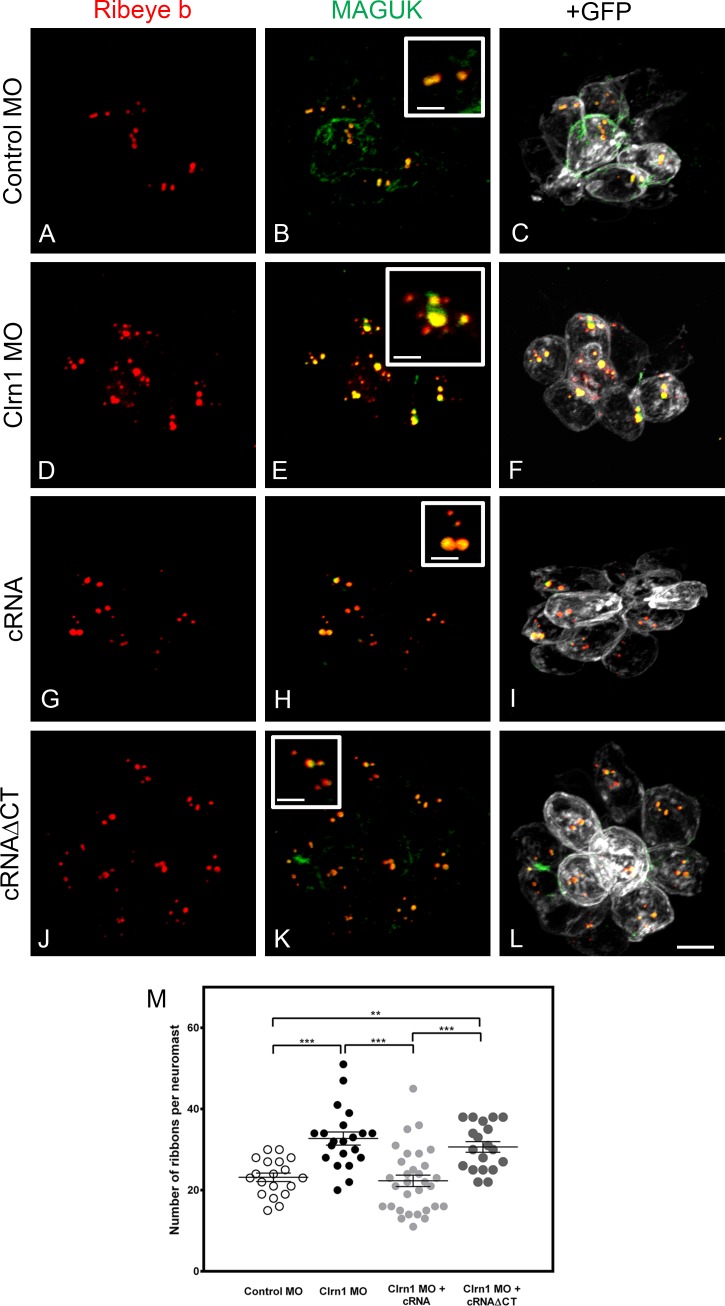
Figure 9.
Clarin-1 MOs show dysregulation in the number of ribeye b boutons in neuromasts. (A–L) Representative experiments of 3 dpf neuromasts from Tg(bnr3c:mGFP) immunostained for ribeye b and MAGUK in control MOs (A–C), clarin-1 (Clrn1) MOs (D–F), MOs + cRNA (G–I), or cRNAΔCT (J–L). (insets) High magnification of juxtaposed ribeye b/MAGUK boutons. Bars: (main images) 5 µm; (insets) 2 µm. (M) Quantification of ribeye b punctate per neuromast. Results from each independent experiment are represented by open (control animals) or filled (treated animals) circles. Mean for each treatment is depicted as a line with error bars representing SEM. N, number of independent experiments (neuromasts analyzed), n > 14. **, P < 0.01; ***, P < 0.001.

