
FIG. 2.
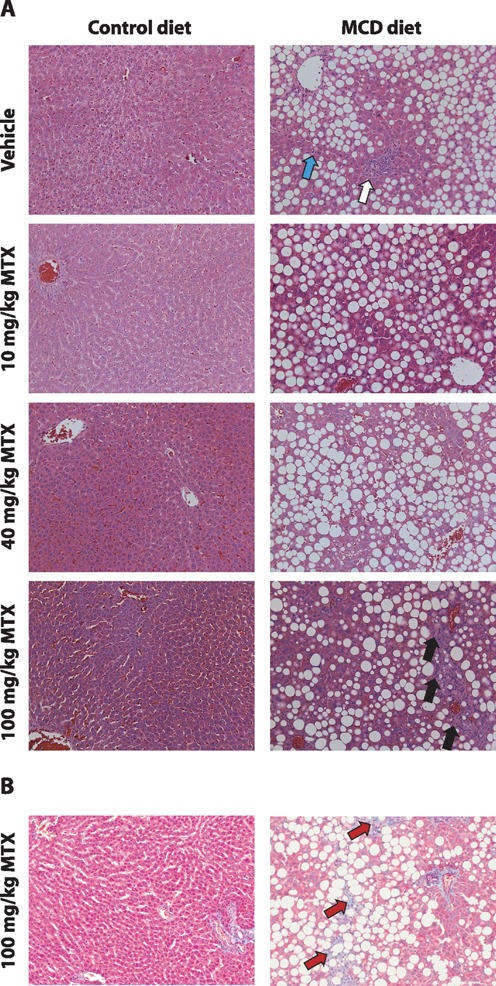
(A) Representative histology images of H&E-stained control and MCD liver sections following vehicle or 10, 40, or 100-mg/kg MTX and (B) Masson Trichrome stained liver sections following 100-mg/kg administration in both diets (×20 magnification). White and cyan arrows indicate inflammation and single cell necrosis in the MCD diet cohort baseline respectively. Black and red arrows indicate biliary hyperplasia and liver fibrosis, respectively, in the MCD cohort following administration of MTX (100 mg/kg).