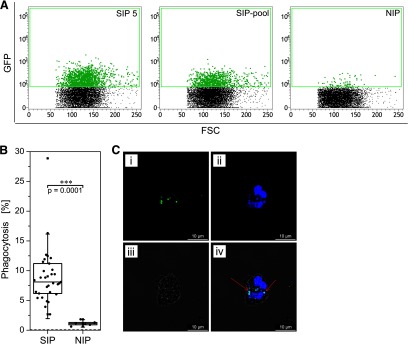
Figure 6. Confirmation of phagocytosis by flow cytometry and confocal laser-scanning microscopy.

PMNs were isolated and exposed to Pf D10 ACP(transit)-GFP merozoites (opsonized with decomplemented plasma) for 10 min at 37°C and analyzed immediately by flow cytometry. GFP-positive PMNs (phagocytosis signal) were gated and are highlighted in green (A). Differences in the rates of phagocytosis when comparing merozoites opsonized by 31 SIPs or six NIPs were estimated using the Mann-Whitney test (B). The dashed line at the bottom of the panel shows the background phagocytosis of merozoites incubated in HBSS instead of plasma. (C) The intracellular location of the merozoites was verified by confocal laser-scanning microscopy. (i) GFP-fluorescent merozoites are shown. (ii) The nuclei of PMNs and merozoites were counterstained with Hoechst 33342. (iv) The overlay image includes (iii) the bright field image. (iv) Red arrows show representative merozoites in which the GFP and Hoechst 33342 fluorescence signals are colocalized. Original scale bars, 10 μm.
