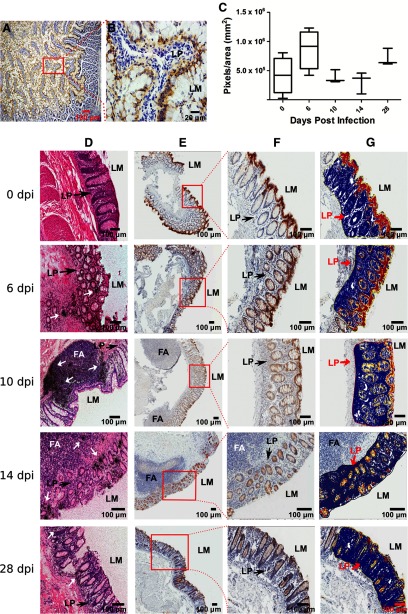
Figure 3. IFN-ε expression in the gut mucosae of uninfected and SIV-infected macaques.
Representative micrographs of IFN-ε expression (stained as brown) in the epithelial cells lining the jejunum (A and B) and rectums (E–G, top) of seven SIV-uninfected Indian rhesus macaques, detected using IHCS. (C) Quantitative analysis of IFN-ε expression in the rectums of uninfected or 12 SIV-infected macaques; the box plot shows the ratio of IFN-ε-positive pixels versus the epithelial area in pixels. The differences were not significant (horizontal black line denotes the median, boxes denote 25 and 75 percentiles, and whiskers denote the sd). (D) SIV vRNA+ cells in rectums detected using in situ hybridization with an S35-labeled riboprobe. After radioautographic development, the clusters of discrete black silver grains (white arrows) overlay the vRNA+ cells at 6, 10, 14, and 28 days postinoculation (dpi). (E) Representative images of IFN-ε staining in infected rectal tissues from three male animals at each time-point postinfection. (F) The images at high magnification from the boxes in image E. (G) Markup images, in which red, pink, and yellow represent strong, medium, and weak positive signals, respectively, used for quantification of IFN-ε in SIV-uninfected and infected rectums at different time-points postinfection. FA, Follicular aggregate.

