
Figure 4. Phylogenetic analysis of IFN-ε from the rhesus macaque, other nonhuman primates, mice, and humans.
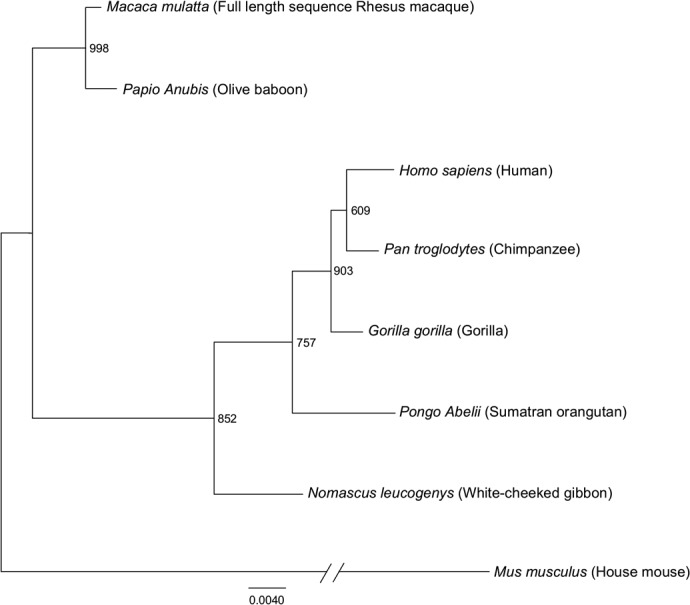
The phylogenetic relationship of the full-length IFN-ε mRNA sequences derived from the rhesus macaque obtained in this study, other nonhuman primates, mice, and humans was analyzed using the maximum likelihood method based on the JTT matrix-based model. The tree is drawn to scale, with branch lengths measured in the number of nucleotide substitutions per site. The tree with the highest log likelihood is shown. The percentage of the trees in which the associated taxa are clustered together is indicated on the branches (out 1000 bootstrap replicates). The mouse sequence was used as an out-group and redrawn to condense the tree. The tree was generated in PhyML, and the text was modified in FigTree.