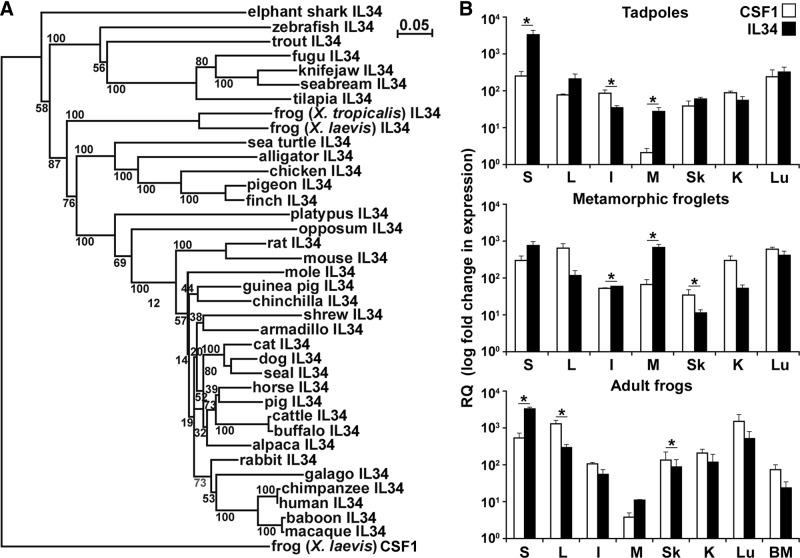
Figure 1. Characterization of X. laevis IL-34 (A) phylogeny and (B) CSF-1 and IL-34 quantitative tissue gene expression.
(A) The phylogenetic tree was constructed from multiple deduced protein sequence alignments using the neighbor-joining method and bootstrapped 10,000 times (denoted as percent). (B) Outbred premetamorphic (stage 54) tadpoles and metamorphic (stage 64) and adult (2 years old) frog tissues were assessed. Tissues from three individuals of each stage were examined (n=3). *P < 0.05, statistical difference between indicated groups. Tissues examined: S, spleen; L, liver; I, intestine; M, muscle; Sk, skin; K, kidney; Lu, lung; BM, bone marrow. RQ, Relative quantification.

