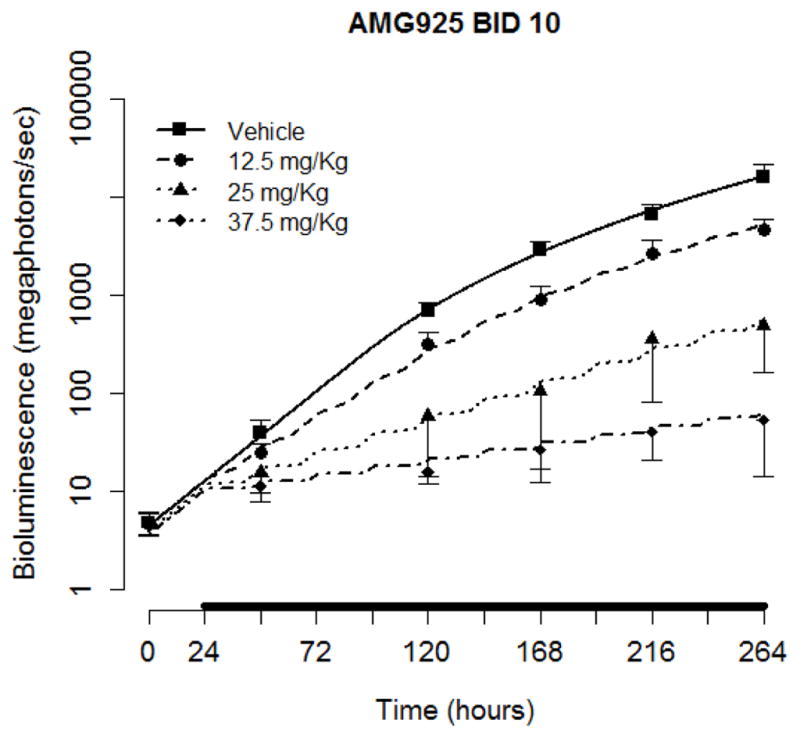
Figure 10.

Tumor burden model performance for AMG925 orthotopic tumor studies. Symbols are the measured bioluminescence (mean+/−std), and solid lines are the mean of individual model predictions for each dose level. The black bars on the x-axis indicate the duration of dosing events.
