Figure 1.

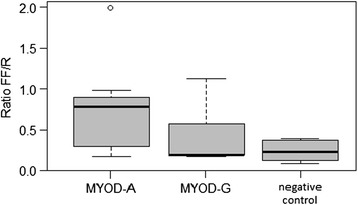
Box plot of the MYOD1 variant expression in CHO cells. The lines extending vertically from the boxes indicating variability outside the upper and lower quartiles. The outliers are plotted as circles.

Box plot of the MYOD1 variant expression in CHO cells. The lines extending vertically from the boxes indicating variability outside the upper and lower quartiles. The outliers are plotted as circles.