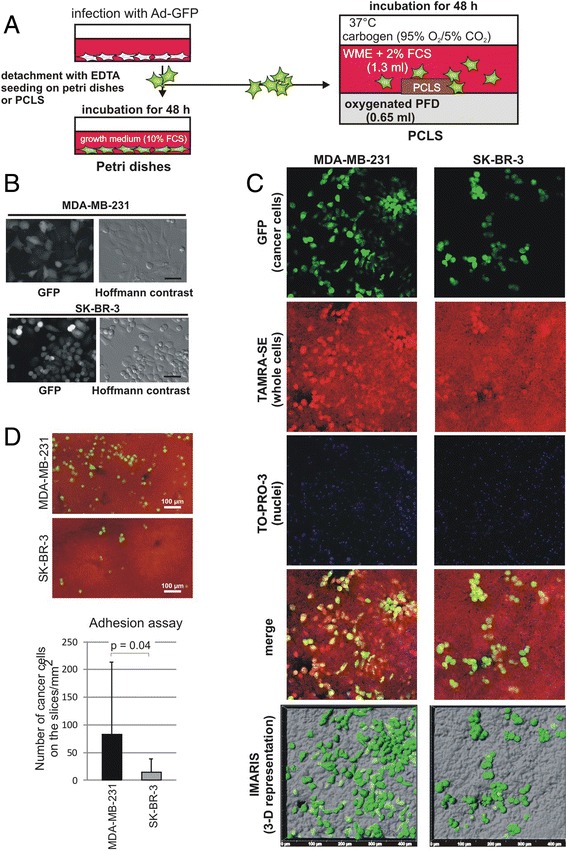
Figure 3.

Cancer cells adhere onto liver slices. (A): Workflow for the cancer cell adhesion assay using murine PCLS. Cancer cells, MDA-MB-231 or SK-BR-3 cells, were infected with adenovirus carrying GFP (Ad-GFP) 24 h prior to seeding onto petri dishes or PCLS. Cells on the petri dish were incubated in their normal growth medium. For the cancer cell adhesion assay, 1 × 10⁵ cells were suspended in WME containing 2% FCS and were plated onto PCLS in a PFD-containing liquid/liquid culture. Cells were further incubated for 48 h. (B): Living cells on the petri dish were photographed using a Nikon Eclipse TE 300 fluorescence microscope (Düsseldorf, Germany). Bar represents 30 μm. (C): PCLS with cancer cells (green) were fixed, counterstained by TAMRA (red; whole cells) and TO-PRO-3 (nuclear staining; blue in this figure) and photographed using a confocal microscope. merge: Merged photos with three colors. IMARIS (3-D representation): IMARIS analysis software was applied to reconstruct 3-D images. The tissue surface of PCLS (half transparent grey) with cancer cells (green) is shown in top view. (D): Quantitative determination of number of adherent cancer cells: PCLS (red) with MDA-MB-231 (green) or SK-BR-3 cells (green) photographed with a Nikon Eclipse TE 300 fluorescence microscope. GFP positive cells were counted from 18 slices for each cell line from three different mice. P value: student’s t-test.
