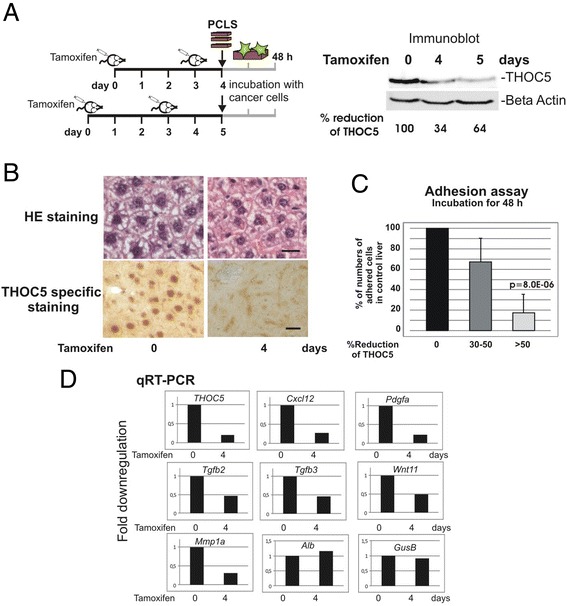
Figure 5.

Tumor cell adhesion assay using PCLS derived from genetically manipulated THOC5 KO mice. (A): Rosa26-CreERT2:THOC5 (flox/flox) mice were injected with Tamoxifen as described previously [31]. Protein was extracted from organs on 0, 4 and 5 days after the first injection, and subjected to THOC5 and actin specific immunoblot. Total protein amount was standardized by actin (Beta Actin) specific immunoblot. Signal intensity of chemiluminescence was quantified using TINA 2.0 software (Raytest Isotopenmessgeraete GmbH, Straubenhardt, Germany) and percent (%) reduction of THOC5 level is shown. (B): HE staining or THOC5 specific staining of paraffin sections from before (0 day) and after (4 days) tamoxifen injection. Bars represent 20 μm. Seven independent experiments were performed and an example of representative data is shown here. (C): GFP labelled MDA-MB-231 cells were plated onto PCLS from control liver or THOC5 depleted livers and incubated for 48 h. GFP positive cells on the slices (percentage of number of adhered cells to numbers on the control slices) were counted from 3–6 slices of each samples from 7 THOC5 knockout mice. P value: student’s t-test. (D): RNAs were extracted from liver and were supplied for the THOC5, Cxcl12, Pdgfa, TGFb2, TGFb3, Wnt11, Mmp1a, Alb (Albumin), GusB, and Gapdh gene specific qRT-PCR (all primers are shown in Table 1). All data were standardized to the Gapdh level. Three independent experiments were performed.
