
Figure 3.
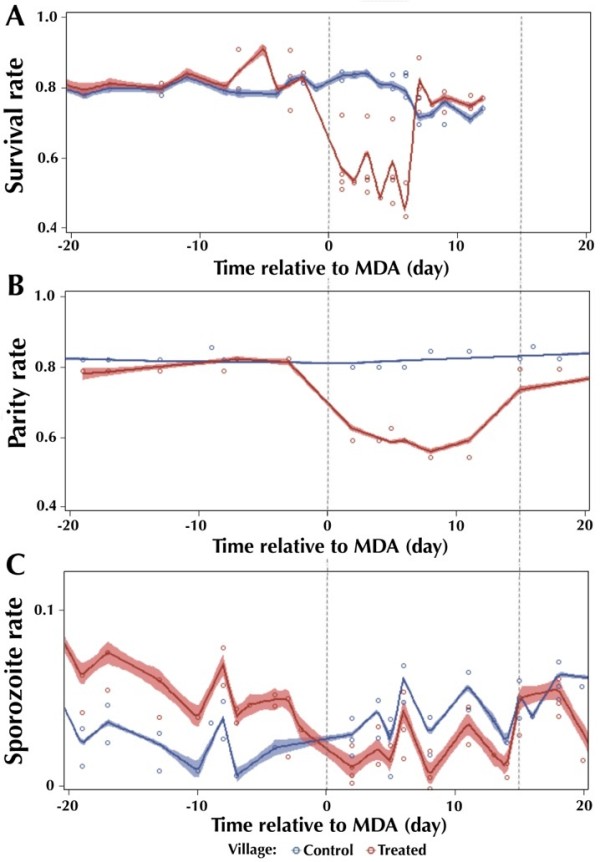
Dynamic of survival (A), parity (B), and sporozoite (C) rates across time relative to mass drug administration. Daily data points represented as circles from control (blue) and treated (red) villages, with the computed 95% confidence intervals using the local regression method (LOESS) in SAS software.