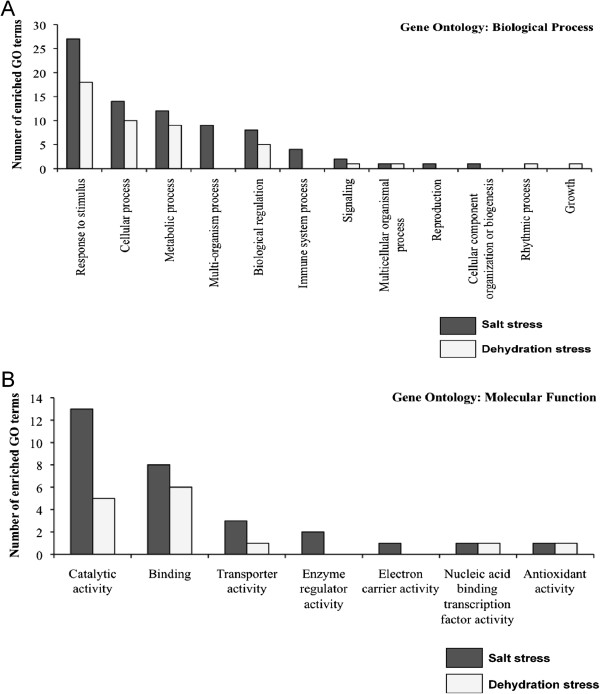
Figure 12.

Gene ontology biological process (A) and molecular function (B) categories significantly (corrected P <0.05) overrepresented among differentially expressed genes under dehydration and salt stress. Differentially expressed genes under dehydration and salt stress were annotated using the top Arabidopsis hit, and then screened for overrepresented GO terms against all soybean genes using Fisher’s exact test [66] and Bonferroni [67] corrected significance value of less than 0.05 (Additional file 31: Table S11). The overrepresented GO terms were enriched at the second level using BLAST2GO v.2.7.1 [68] and are shown in the figure.
