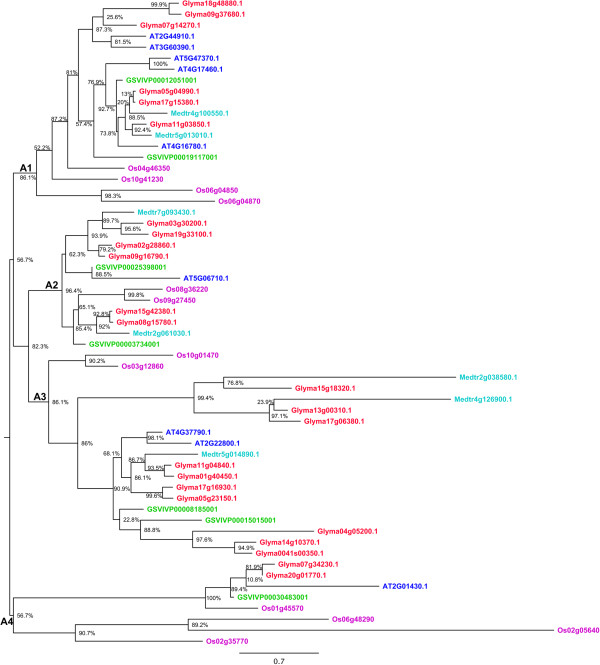
Figure 2.

Phylogenetic relationships of HD-Zip II proteins from soybean, Medicago , Arabidopsis , grape and rice. The phylogenetic tree was built using the maximum likelihood method implemented in PhyML. The letters A1- A4 represent ancient angiosperm clades, based on whole genome duplication events, and the copy number of genes from each of the species. The branch support values estimated using approximate likelihood ratio test (aLRT) are displayed in percentages. Rooting of the tree was inferred from Ariel et al. [1], angiosperm clade composition, and outgroup sequences from other subfamilies. Genes from each of the species are highlighted in different colors, soybean (red), Medicago (light blue), Arabidopsis (dark blue), grape (green), and rice (Pink).
