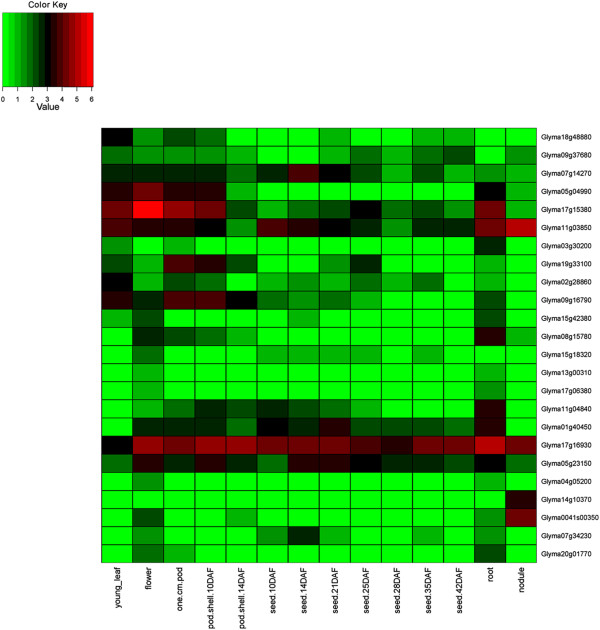
Figure 7.

Expression profiles of HD-Zip II genes in 14 tissues of soybean. The Reads/Kb/Million (RPKM) normalized values of expressed genes was log2-transformed and visualized as heatmaps. Genes in the heatmap are ordered for consistency with the phylogeny in Figure 2. The abbreviation “DAF” in the tissue label represents “Days after flowering”.
