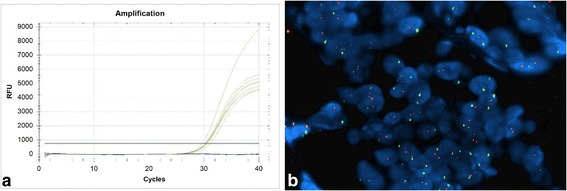
Figure 4.

EGFR molecular analyses. a) Absence of mutations detected by RT-PCR method (the yellow increased curves indicate the internal controls of the kit, the blue flat lines indicate our sample); b) Absence of chromosomal aberrations detected by FISH method (red signals represent the EGFR gene and green signals represent the centromeric sequence in chromosome 7. The above picture shows a balanced disomy (each nucleus with 2 red and green signals, ratio = 1; Magnification, ×60)).
