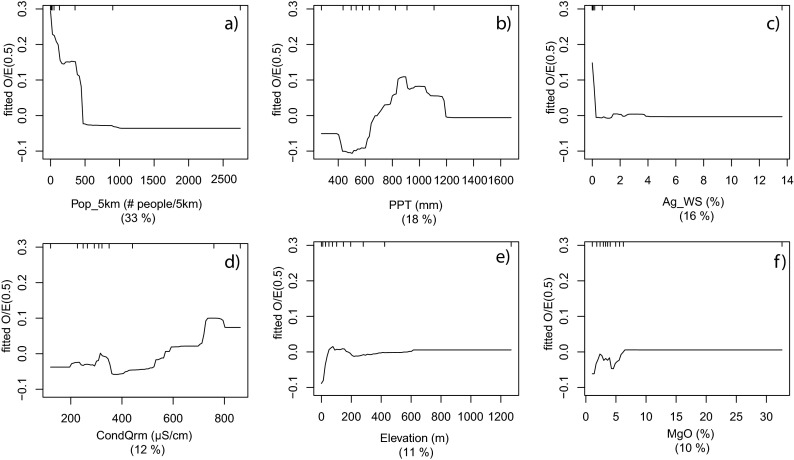
Fig. 4.
Partial dependency plots for the final Coastal Chaparral model (n = 216) of the response form of O/E50 (y-axis = fitted function of O/E50) based on the effect of individual explanatory variables with the response of all other variables removed. Variables are shown in order of model importance: a population density in 2000 at 5 km scale (Pop_5km); b average precipitation (PPT); c agricultural land use at watershed scale (Ag_WS); d predicted conductivity (CondQrm); e average temperature (Temp); and f Percent magnesium oxide mineral content (MgO). The top tick marks of each plot indicate deciles of the predictor variable

