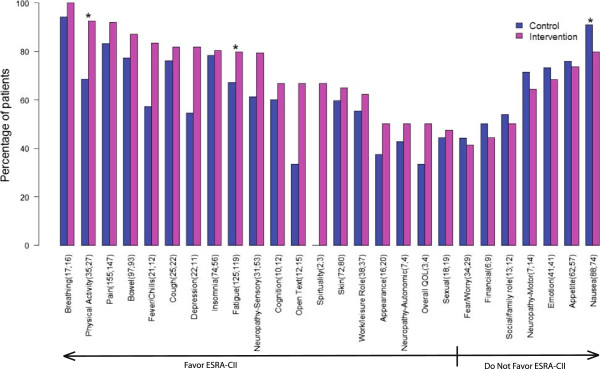
Figure 4.

Percentage of problematic SxQOL issues reported as coached, by study group. For each SxQOL issue, the number of patients' visits (n control, n intervention) in which the issue was defined as a problem is shown and the percentage of visits in which the patient or caregiver made unprompted reports of severity, pattern, or alleviating/aggravating factors, or requested help for the SxQOL issue. (*) denotes a p-value of ≤ .05 for the difference between study groups in reporting percentage.
