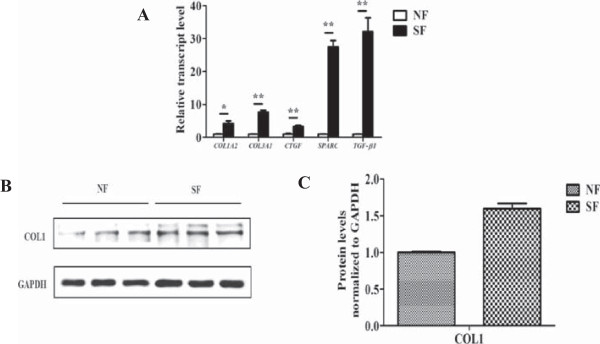
Figure 2.

Gene expressions and collagen production between SSc dermal fibroblasts and normal controls. (A) Relative transcript levels of COL1A2, COL3A1, CTGF, SPARC and TGF-β1 in three SSc dermal fibroblasts and normal controls. The expression level of each gene in normal controls was normalized to 1. *, P <0.05; **, P <0.001. SF, SSc dermal fibroblast; NF, normal dermal fibroblast. (B) Western blotting analysis of type I collagen (COL1) in the three SSc dermal fibroblasts and normal dermal fibroblasts. (C) Densitometric analysis of western blotting for type I collagen (COL1). Bars showed the mean ± SD results of three paired fibroblast strains (normal and SSc). *, P <0.05; **, P <0.001.
