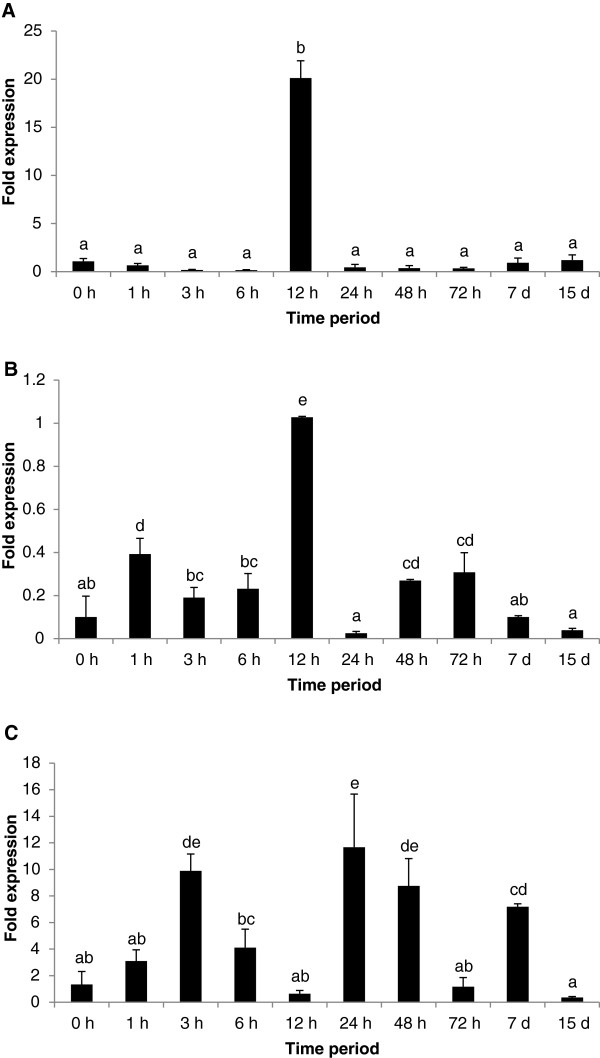
Figure 5.

Temporal expression analysis of the perforin gene in spleen (A), liver (B) and gill (C) tissues of L. rohita hours (h) and days (d) after infection with A. hydrophila. Fold expression was calculated as 2-∆∆Cq. The control group (0 hour post-challenge) was used for calibration. Bars bearing different superscript are significantly different (P < 0.05).
