Figure 7.

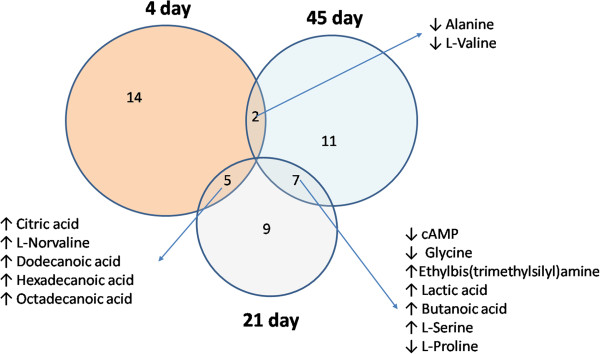
The conclusion of plasma metabolite changes at each time point after operation. Venn diagram showing the distribution of metabolites altered in different time point.

The conclusion of plasma metabolite changes at each time point after operation. Venn diagram showing the distribution of metabolites altered in different time point.