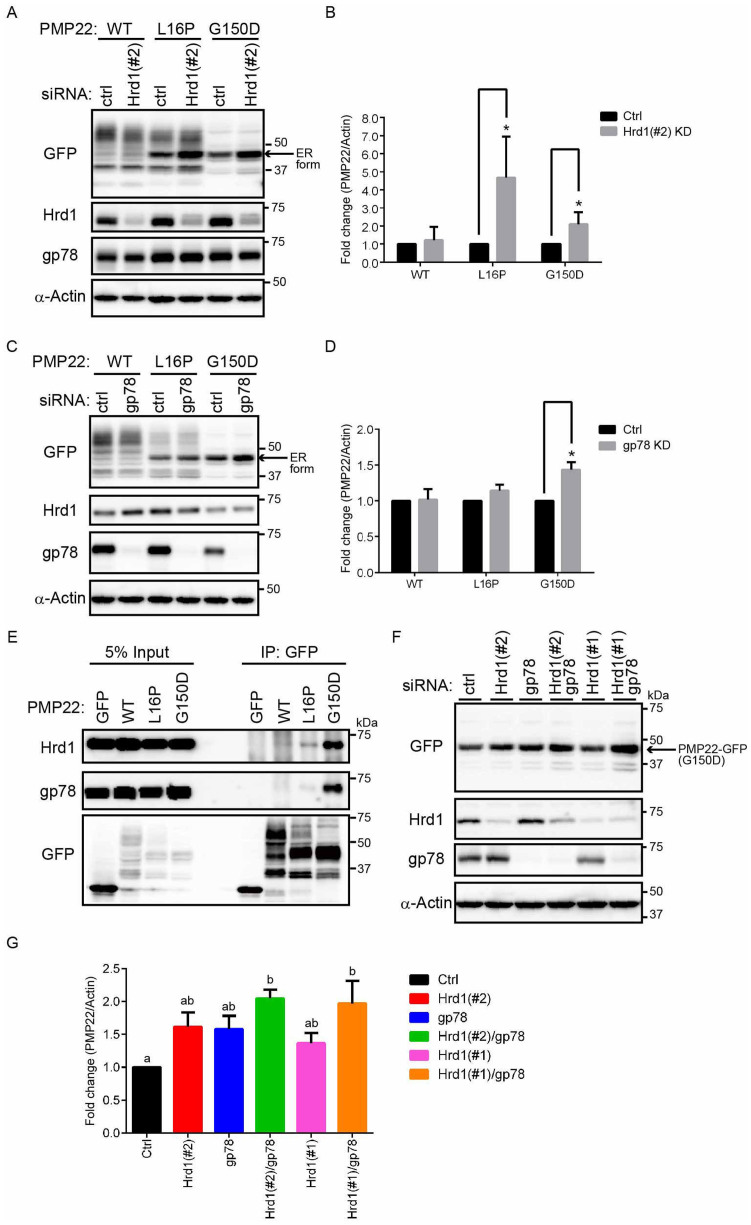
Figure 2. E3 ubiquitin ligases Hrd1 and gp78 are involved in the degradation of PMP22 localized to the ER.
(A) Cells transfected with Hrd1-siRNA accumulated mutant PMP22. HeLa cells stably expressing WT or mutant PMP22-GFP were transfected with control or Hrd1 (#2) siRNAs for 3 days. Immunoblots of cell lysates were probed with the indicated antibodies. (B) The signal intensities of each PMP22-GFP derivative and α-actin were quantified using image J software, and the amount of each PMP22-GFP derivative was normalised to the amount of α-actin. To compare the amounts of PMP22-GFP derivatives in control cells with that in Hrd1-knockdown cells, we calculated fold changes by expressing each normalised value relative to the normalised value obtained with each PMP22-GFP derivative in control cells. Values indicate the mean ± standard error of the mean (SEM) of three independent experiments. *P < 0.05 (Student's t-test). (C) Cells transfected with gp78-siRNA accumulated PMP22(G150D) mutant. HeLa cells stably expressing WT or mutant PMP22-GFP were transfected with control or gp78 siRNAs for 3 days. Immunoblots of cell lysates were probed with the indicated antibodies. (D) Loss of gp78 increased the protein level of the G150D mutant. The signal intensities of each PMP22-GFP derivative and α-actin were quantified using image J software, and the amount of each PMP22-GFP derivative was normalised to the amount of α-actin. The fold changes (PMP22-GFP/actin) were analysed as described in panel B. (E) PMP22 mutants bind to Hrd1 and gp78. Extracts prepared from HeLa cells stably expressing WT or mutant PMP22-GFP were immunoprecipitated (IP) using an anti-GFP antibody. The resulting precipitates were examined with immunoblot analysis using the indicated antibodies. (F) Additive effect of Hrd1 and gp78 coinactivation on PMP22(G150D) degradation. HeLa cells stably expressing PMP22(G150D)-GFP were transfected with control or siRNAs against Hrd1 (#1 or #2), gp78, or both for 3 days. Lysates prepared from these cells were immunoblotted using the indicated antibodies. Note that a half amount of siRNA used in panels A and C was used for knockdown of Hrd1, gp78, or both. (G) Quantitative analysis of the levels of PMP22(G150D)-GFP. The signal intensities of each PMP22(G150D)-GFP and α-actin were quantified using image J software, and the amount of each PMP22(G150D)-GFP was normalised to the amount of α-actin. The fold changes (PMP22-GFP/actin) were analysed as described in panel B. Histograms show the average value ± SEM from triplicate tests. Different lettered superscripts (a, b, ab) indicate significant differences at P < 0.05 (one-way analysis of variance [ANOVA]). Note that cropped western blots are shown, and full-length images are presented in the supplementary information.

