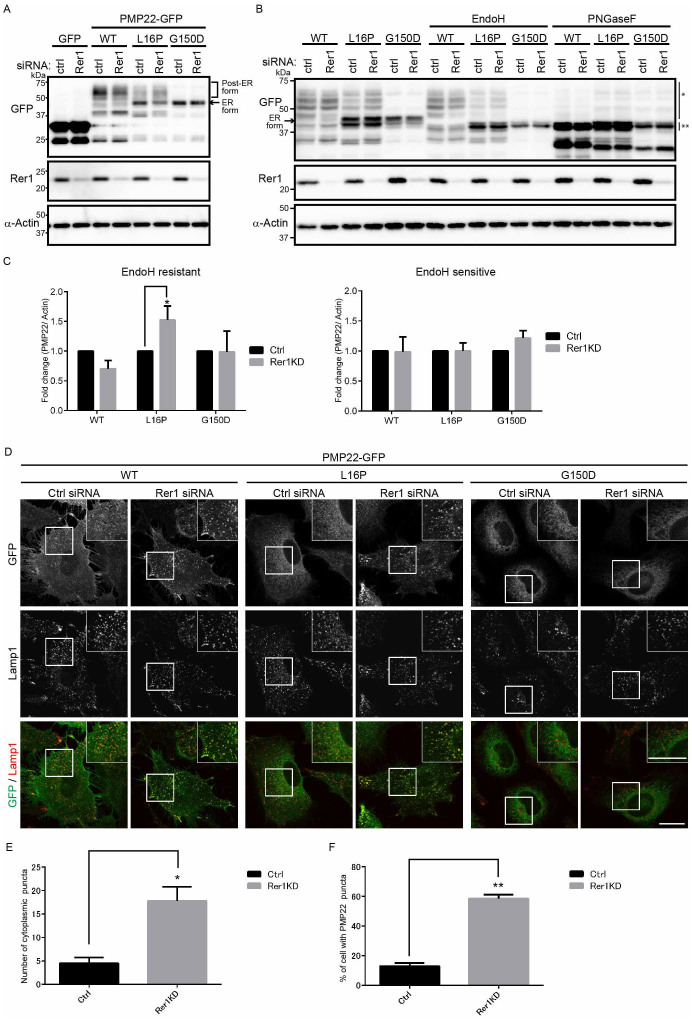
Figure 3. A portion of PMP22 (L16P) is retained in the ER by Rer1.
(A) Knockdown of Rer1 increases the post-ER form of the PMP22(L16P) mutant. HeLa cells stably expressing WT or mutant PMP22-GFP were transfected with control or Rer1 siRNAs for 3 days. Immunoblots of total cell lysates were probed with the indicated antibodies. (B) Glycosylation states of PMP22-GFP in Rer1-knockdown cells. HeLa cells stably expressing WT or mutant PMP22-GFP were treated with control or Rer1 siRNA for 3 days. Cell lysates were treated with or without endoglycosidase H (Endo H) or protein:N-glycanase F (PNGase F) and subjected to immunoblotting using the indicated antibodies. * and ** indicate the Endo H-resistant form of PMP22-GFP and the deglycosylated (Endo H-sensitive) form of PMP22-GFP, respectively. An arrow indicates the ER form of PMP22-GFP. (C) The signal intensities of Endo H-resistant (left graph) or sensitive (right graph) fractions of each PMP22-GFP derivative and α-actin were quantified using Image J software, and the amounts of the fractions of each PMP22-GFP were normalised to the amount of α-actin. To compare the transport efficiencies of WT and mutant PMP22-GFP, we calculated the fold changes by expressing each normalised value relative to the normalised value obtained with each PMP22-GFP derivative in control cells. Values indicate the mean ± SEM of four independent experiments. Two-way ANOVA was used to determine the significance of the differences. *P < 0.05 (ANOVA). (D) Knockdown of Rer1 releases a portion of the PMP22(L16P) mutant from the ER. HeLa cells stably expressing WT or mutant PMP22-GFP were treated with control or Rer1 siRNA for 3 days and then cells were immunostained using an anti-Lamp1 (late endosome/lysosome marker) antibody and observed using confocal laser scanning microscopy. Scale bars, 10 μm. (E) The graph shows the average number of PMP22-positive puncta per cell. More than 30 cells were counted in each experiment. Three independent experiments were conducted. Error bars represent the SEM; *P < 0.05 (Student's t-test). (F) The graph shows the percentages of cells containing more than 10 PMP22-positive puncta. More than 30 cells were counted in each experiment. Three independent experiments were conducted. Error bars represent the SEM; **P < 0.01 (Student's t-test). Note that cropped western blots are shown, and full-length images are presented in the supplementary information.

