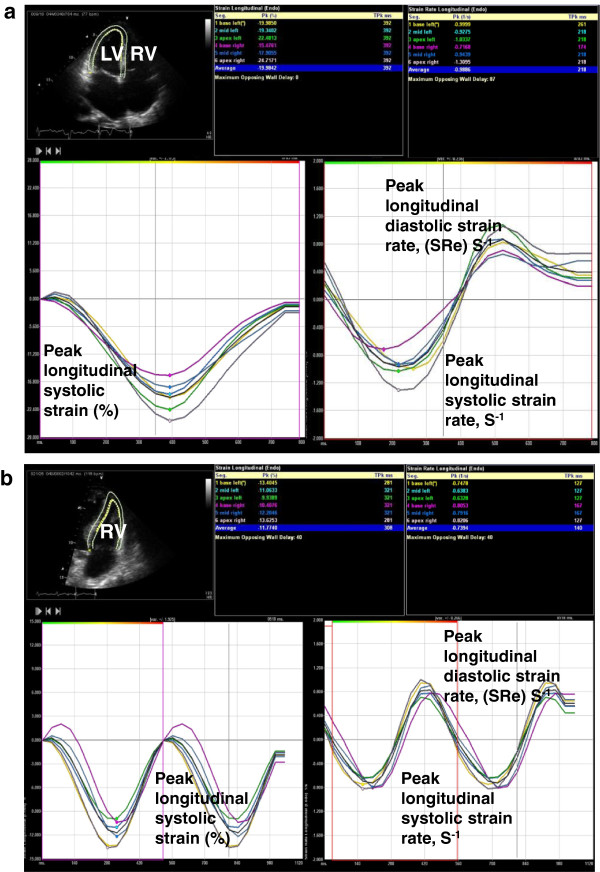
Figure 1.

Longitudinal strain and strain rate curves. (a) Representative recording for apical four-chamber longitudinal strain and strain rate curves for a patient with normal left ventricle (LV) systolic function. Echo image displayed in Mayo format: left, LV; right, right ventricle (RV). Negative strain values indicate tissue contraction. Strain rate determined by change in strain over time. (b) Representative recording for apical four-chamber RV longitudinal strain and strain rate curves for a patient with abnormal RV systolic function. Echo image displayed in Mayo format: left, LV; right, RV. RV free wall longitudinal strain determined by the average of base, mid and apical free wall segments.
