
Figure 2.
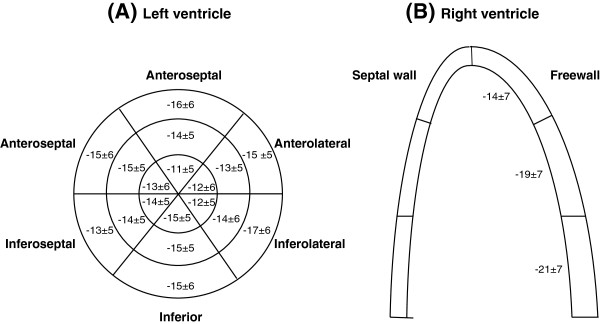
Left and right ventricle segmental longitudinal strain values. (A) Graphical representation of left ventricle segmental longitudinal strain with three concentric circles representing apex (inner circle), mid and base (outer circle). (B) Graphical representation of right ventricle segmental free wall longitudinal strain. Data presented as mean ± standard deviation.