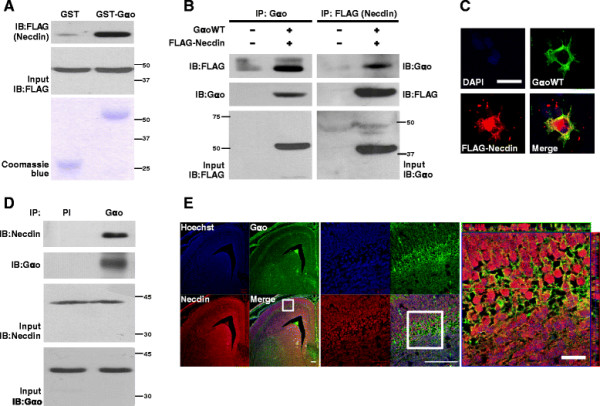
Figure 1.

Gαo interacts with Necdinin vitroandin vivo. (A) Beads charged with bacterially expressed GST or GST-Gαo were incubated with 293T cell extracts expressing 10 μg of plasmid encoding FLAG-Necdin. After extensive washing with PBTX buffer, bound proteins were immunoblotted with antibodies against FLAG. Input was loaded with 10% of 293T cell extracts used for the GST pulldown assay, and Coomassie blue staining used to estimate the levels of GST and GST-Gαo proteins. The numbers beside blot indicate size marker (kDa). (B) Lysates (500 μg) of 293T cells mock-transfected and expressing GαoWT (3 μg) and FLAG-Necdin (3 μg) plasmids were incubated with antibodies against Gαo or FLAG, as indicated, and the immunoprecipitates immunoblotted with anti-FLAG and Gαo antibodies. Input was loaded with 10% of 293T cell extracts used for the immunoprecipitation assay. (C) 293T cells co-transfected with the plasmid encoding GαoWT (0.1 μg) and FLAG-Necdin (0.25 μg) were subjected to immunofluorescence analysis using anti-Gαo and Alexa Fluor 488-conjugated secondary (green fluorescence) antibodies and anti-FLAG and Alexa Fluor 568-conjugated secondary antibodies (red fluorescence). Co-localization of the two types of fluorescence is indicated in yellow in the merged image. The DAPI image represents the cell nucleus. Scale bar = 20 μm (D) Newborn rat brain extracts (500 μg) were immunoprecipitated with 1 μg of pre-immune serum (PI) and anti-Gαo antibodies. Immunocomplexes were analyzed by immunoblot analysis using antibodies against Necdin and Gαo. Input was loaded with 10% of brain extracts used for the immunoprecipitation assay. (E) Mouse brain (E15.5) section was subjected to immunofluorescence analysis using anti-Gαo and Alexa Fluor 488-conjugated secondary (green fluorescence) antibodies and anti-Necdin and Alexa Fluor 594-conjugated secondary antibodies (red fluorescence). Co-localization of the two types of fluorescence is indicated in yellow in the merged image. The Hoechst image represents the cell nucleus. Scale bar = 100 μm/100 μm/20 μm.
