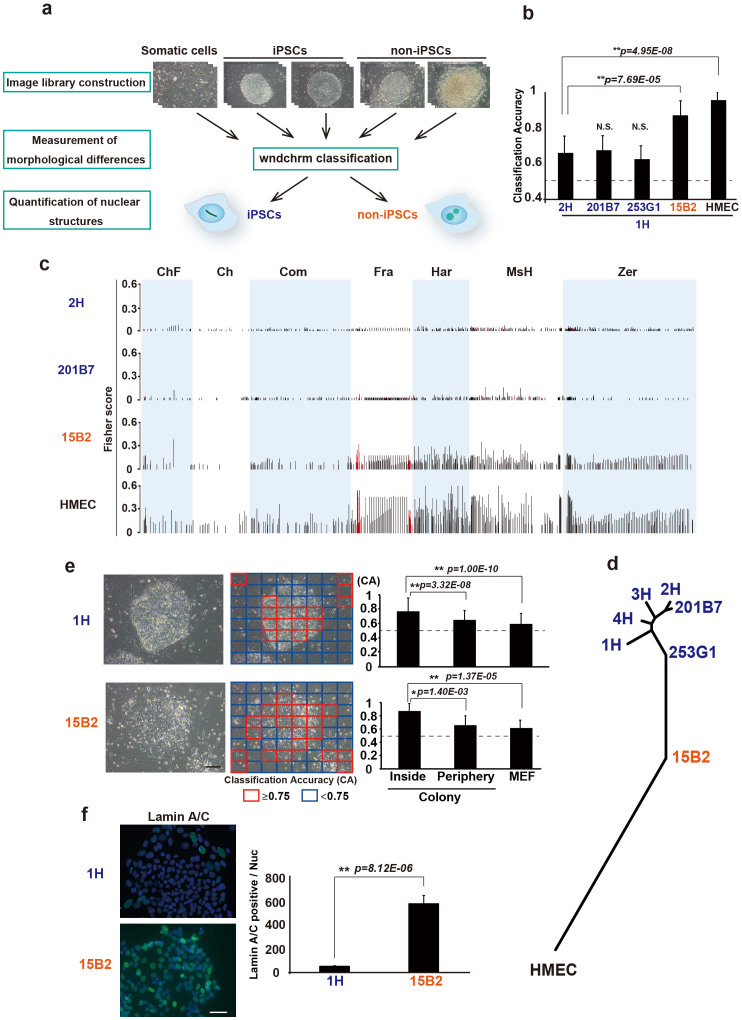
Figure 1. Quantitative classification of completely and incompletely reprogrammed human iPSC colonies.
(a) Experimental Overview. iPSCs and non-iPSCs are indicated as blue and red, respectively. (b) Binary classification of colony images against iPSCs (1H). Classification accuracy (CA) indicates the level of morphological differences between two cell types. CA value of two cell types with no feature differences is expected to be 0.5 (dotted line). The values are the means and standard deviation (s.d.) from 10 independent tests. N.S., not significant. (c) Fisher discriminant scores assigned to the 2873 features for each test in Fig. 1b. The values were calculated from raw (red bars) and transformed images (black bars). The name of each feature group is described in Supplementary Table S1. (d) Phylogeny based on morphological similarities. (e) Specification of the areas that distinguish iPSC (1H) and non-iPSC (15B2) colonies. CA values for each sub-image are shown as high (red) and low (blue). Average CA values inside, at the periphery, and outside of the colony (MEF, mouse embryonic fibroblast) are shown on the graph. (f) Selective expression of lamin A/C in the periphery of the iPSC colony. Immunofluorescence images of lamin A/C (green) and DAPI (blue), and quantified intensities are shown at the right (n>600). Values are the means and s.d. *, p<0.05; **, p<0.01. Scale bars, 200 μm.

