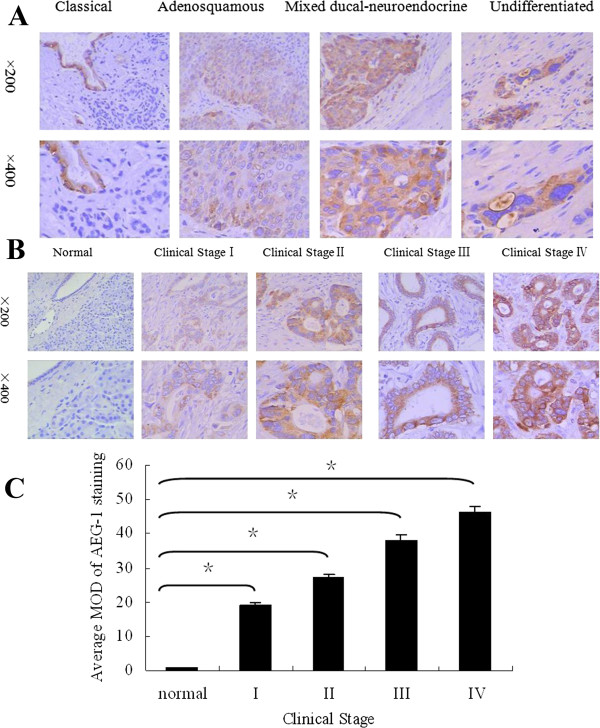
Figure 3.

Immunohistochemical analysis of AEG-1 protein overexpression in archived paraffin-embedded PDAC tissue sections. (A) Representative images of immunohistochemical analyses of AEG-1 expression in four different histological types of PDAC. (B) Representative images of immunohistochemical analyses of AEG-1 expression in normal pancreas and PDAC tissue specimens. (C) Statistical analyses of the average MOD of AEG-1 staining between normal pancreas and PDAC tissues specimens of different clinical stages. *P < 0.05.
