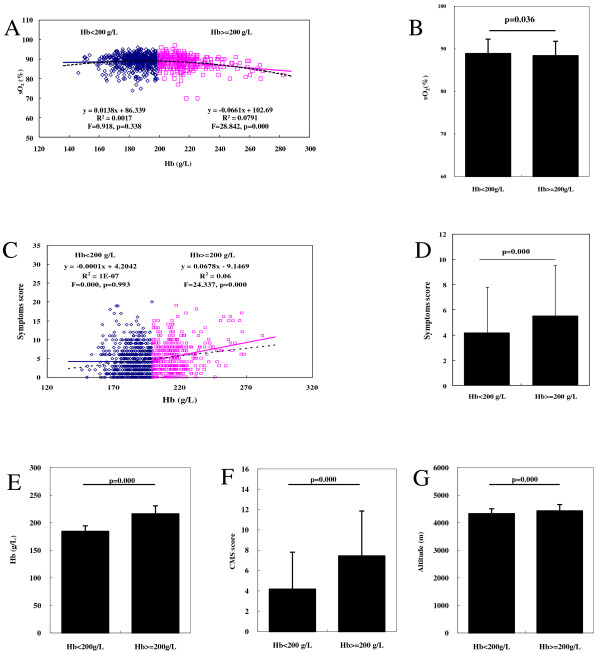
Figure 1.

Correlations among Hb, sO2, and symptoms. (A) Curve fitting analysis of Hb concentration and sO2. (B) Mean sO2 in the groups with an Hb of <200 and ≥200 g/L. (C) Curve fitting analysis of Hb concentration and total symptom score. (D) Total symptom score in the groups with an Hb of <200 and ≥200 g/L. (E) Hb in the groups with an Hb of <200 and ≥200 g/L. (F) CMS scores in the groups with an Hb of <200 and ≥200 g/L. (G) Altitude in the groups with an Hb of <200 and ≥200 g/L.
