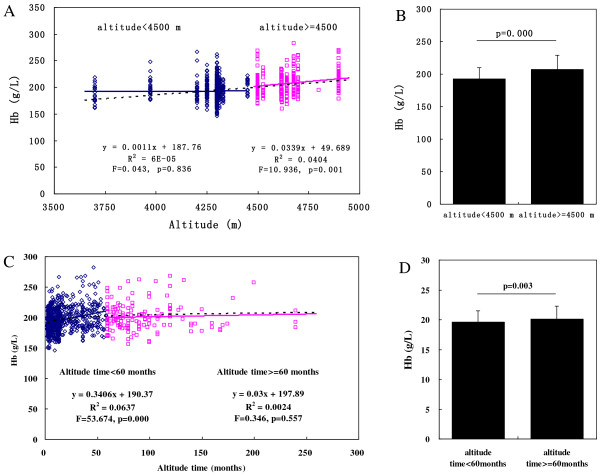
Figure 2.

Correlations of Hb, symptom score, and CMS score with altitude and length of residence at high altitude. (A) Curve fitting analysis of Hb concentration and altitude. (B) Hb concentration in the groups at an altitude of <4500 and ≥4500 m. (C) Curve fitting analysis of Hb concentration and length of exposure to high altitude. (D) Hb concentration in the groups with a length of exposure to high altitude of <60 and ≥60 months. (E) Curve fitting analysis of CMS score and altitude. (F) CMS score in the groups at an altitude of <4500 and ≥4500 m. (G) Curve fitting analysis of CMS score and length of exposure to high altitude. (H) CMS score in the groups with a length of exposure to high altitude of <60 and ≥60 months.
