
Figure 2.
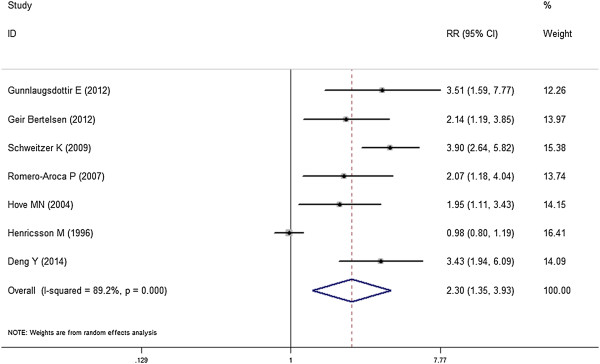
Forest plot: overall meta-analysis of insulin use and DR risk. Squares indicated study-specific risk estimates (size of square reflects the study-statistical weight, i.e. inverse of variance); horizontal lines indicate 95% confidence intervals; diamond indicates summary relative risk estimate with its corresponding 95% confidence interval.