
Figure 3.
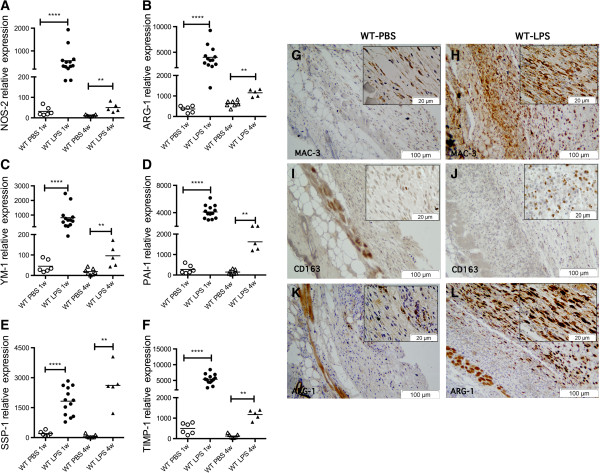
Lipopolysaccharide (LPS) induces overexpression of M1 and M2 macrophage markers, and transforming growth factor (TGF)-β signature genes. (A-F) Gene expression by nanostring, comparing 1-week, LPS- (n = 13, solid circles) with PBS- (n = 6, open circles) treated wild-type (WT) mice; and 4-week LPS- (n = 5, solid triangles) with PBS-treated (n = 7, open triangles) WT mice. **P <0.01, ****P <0.0001. In the dot plot, each data point represents a single sample. Increased gene expression in LPS- compared to PBS-treated WT mice of macrophage markers: (A) NOS2, 1 week, P <0.0001; 4 weeks, P < 0.001. (B) Arginase-1 (ARG-1), 1 week, P <0.0001; 4 weeks, P <0.01. (C) YM1, 1 week, P <0.0001; 4 weeks, P <0.01. (D) Plasminogen activator inhibitor-1 (PAI-1), 1 week, P <0.0001; 4 weeks, P <0.01. (E) SPP1, 1 week, P < 0.0001; 4 weeks, P <0.01. (F) TIMP1, 1 week, P <0.0001; 4 weeks, P <0.01. (G-L) Representative images of MAC-3 (G, H), CD163 (I, J), and ARG-1 (K, L) staining on skin section from WT mice treated with PBS (WT-PBS: G, I, K) or LPS (WT-LPS: H, J, L) for 1 week.