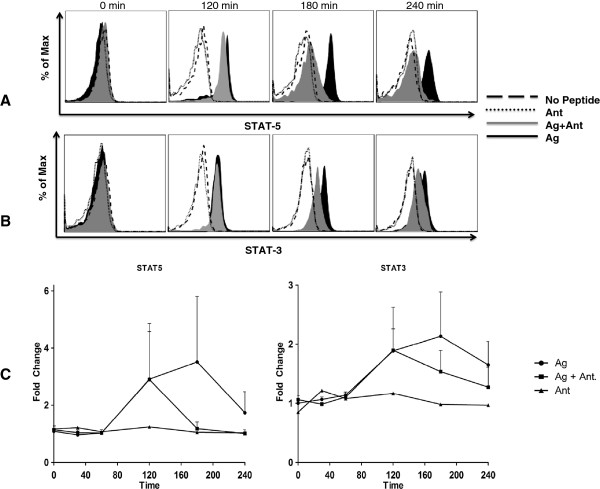
Figure 1.

Phosflow detection of STAT-3 and STAT-5. STAT-3 and -5 were measured by flow cytometry in CD4+ T cell clones co-incubated with peptide (dotted = Ant, black = Ag, grey = Ag + Ant) or mock (dashed = no peptide) pulsed B cells. Panels A and B are one representative experiment of five. Bottom panels (C) show fold change in mean fluorescence intensity (MFI) of STAT-3 and -5 from five experiments; circle = Ag, square = Ag + Ant, triangle = Ant, error bars show standard error of the mean (SEM).
