
Figure 6.
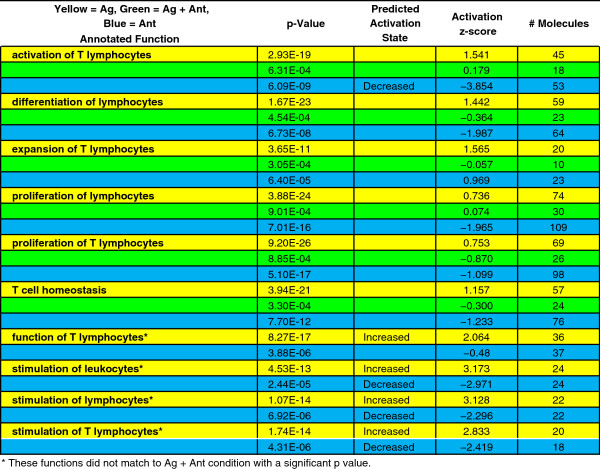
Annotated biological functions associated with Hematological System Development and Function. Annotated functions in the Hematological System Development and Function category that are associated with T lymphocytes with the number of molecules associated with those functions are indicated. Activation z-score as determined based on expression data following core analysis with an expression value cutoff of 0.5. Predicted activation state with activation z-score >2.0 or < -2.0. Yellow = Ag + Ant treatment, Green = Ag treatment.