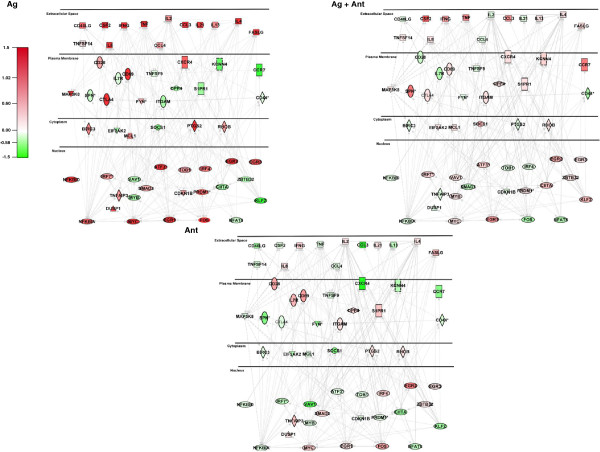
Figure 7.

Pathway analysis of gene array data. We selected annotated functions within the Hematological system development and function category that were involved in all T cell functions and created a network from the 56 molecules represented in at least one of those functions. Molecules were connected based on direct (solid lines) and indirect (dotted lines) interactions and sorted based on subcellular localization. Expression values from Ag treatment, Ag + Ant treatment (Top Panels), and Ant treatment (Bottom Panel) were overlaid on the network, where red indicates positive fold changes and green represent negative fold changes. Square = Cytokine, Rectangle = G-protein coupled receptor, Dashed Rectangle = Ion Channel, Vertical Oval = Transmembrane Receptor, Horizontal Oval = Transcription regulator, Trapezoid = Transporter, Diamond = Enzyme, Hexagon = Peptidase, Pentagon = Phosphatase, Triangle = Kinase, Circle = Other, * = multiple expression value identifiers mapped to the same gene.
