
Figure 8.
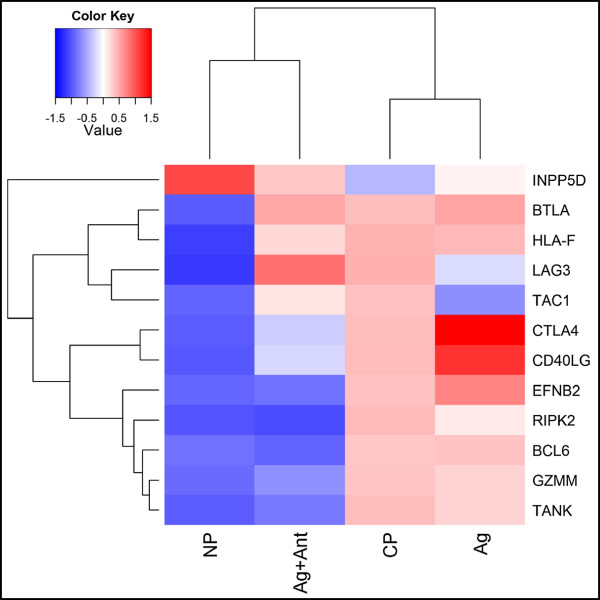
Comparison with lymph node T cell responses of vaccinated macaques. Twelve genes were found to be differentially expressed in non-protected vs. protected macaques, and z-scores for these genes in macaques and Ag and Ag + Ant stimulated T cells were used to generate a heat map. A z-score was calculated for each gene and then mapped by gene and treatment. For the macaque data the z-scores for 10 CP macaques and 4 NP macaques were averaged and mapped for comparison to Ag and Ag + Ant treatments. The clustering dendrogram was generated based on a hierarchical clustering algorithm with completed linkage and Euclidian distance. CP = completely protected macaque, NP = non-protected macaque.