Figure 1.

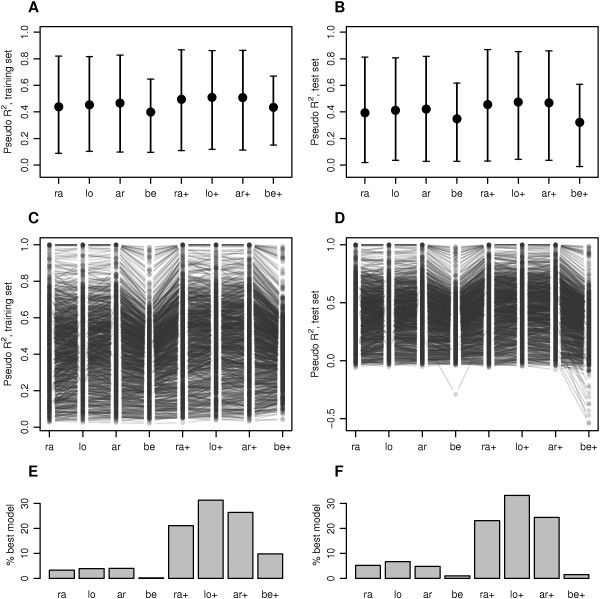
Performance of competing models for DNA methylation data. A and B Median, 5% and 95% quantile of pseudo R 2 in training and test data set, respectively, across the CpG sites. C and D Pseudo R 2 values of individual CpG sites in training and test data set, respectively. 1000 CpG sites were randomly chosen for this plot. E and F Proportion of CpG sites for which the respective model had the largest pseudo R 2 measure as compared to the competing models, in training and test data set, respectively. Model abbreviations are explained in Table 1.
