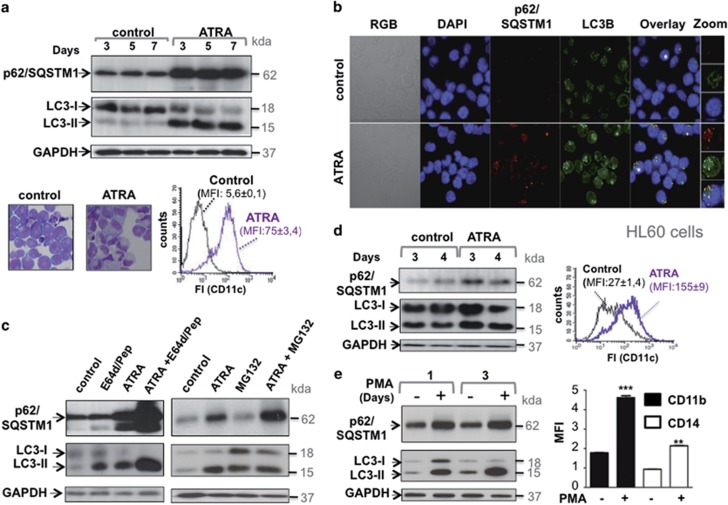
Figure 1.
p62/SQSTM1 protein accumulates during terminal differentiation of acute promyelocytic leukemia (APL) cells. (a) The NB4 APL-derived cells were treated with 1 μM ATRA for the times indicated and then subjected to cell lysis. Upper panel: the p62/SQSTM1 and LC3-II protein levels were assessed following immunoblot analysis using antibodies directed against p62/SQSTM1 and LC3. GAPDH was used as a control. Lower panel: NB4 cells were treated with 1 μM ATRA for 4 days, granulocytic differentiation was determined by morphologic changes of cells stained with May-Grunwald Giemsa or by FACS analysis of the expression of the CD11c cell surface marker. (b) NB4 cells were treated with ATRA (1 μM, for 2 days) before immunostaining with p62/SQSTM1 and LC3 antibodies and examined by fluorescence microscopy. Nuclei were counterstained with DAPI (blue). The orange overlay shows the colocalization of p62/SQSTM1 and LC3 proteins. High-magnification images of cells denoted with asterisks are shown in right panel. (c) the NB4 APL-derived cells were treated with 1 μM ATRA for 3 days in the presence and absence of either E64d (10 μg/ml) and methyl ester pepstatin (1 μg/ml) or MG132 (100 nM). The expression levels of p62/SQSTMI and LC3-II proteins were assessed following immunoblot analysis using antibodies directed against p62/SQSTM1 and LC3. (d) The HL60 AML-derived cells were treated with 1 μM ATRA for 4 days and then subjected to either immunoblot analysis of p62/SQSTM1 and LC3 proteins (left panel) or FACS analysis of the expression of the cell surface granulocyte marker, CD11c (right panel). (e) Immunoblot analysis of p62/SQSTM1 and LC3 proteins in the NB4 cells treated with 100 nM PMA for 1 and 3 days (left, panel). Monocyte differentiation was assessed by FACS analysis of the expression of cell surface monocyte markers, CD11b, and CD14 (right panel). For FACS experiments, fluorescence intensity (FI) was measured for each treatment and results were expressed as median fluorescence intensity, MFI. **P<0.01; ***P<0.001 versus untreated cells. For all of the immunoblots, representative examples are shown

