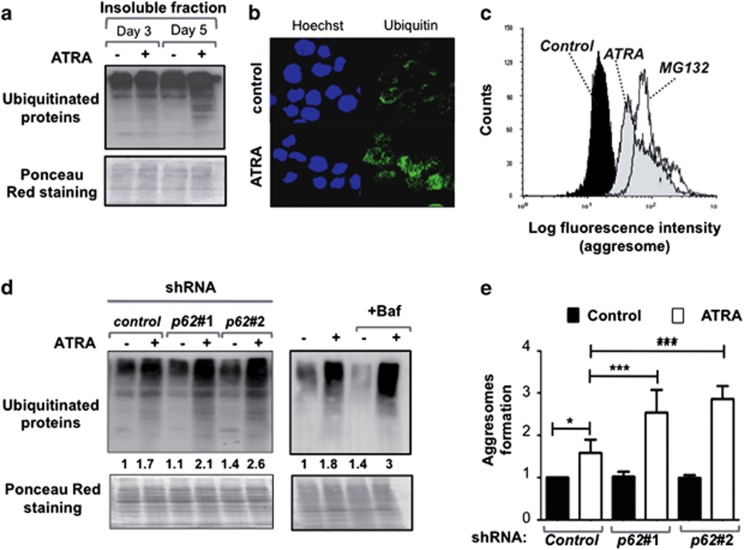
Figure 6.
p62/SQSTM1 regulated the level of ubiquitinated-protein aggregates during terminal differentiation of APL cells. (a) Triton X-100-insoluble protein fractions of NB4 cells treated with 1 μM ATRA for times indicated. Samples were separated by SDS-PAGE and immunoblots were analyzed with antibodies against ubiquitin. (b) Immunofluorescence analysis of ubiquitin staining in NB4 cells treated in the presence and absence of 1 μM ATRA for 4 days. (c) The abundance of aggregated proteins was measured by flow cytometry analysis using the ProteoStat Aggresome detection kit in NB4 cells treated with either ATRA (1 μM, for 6 days) or MG132 (5 μM, for 8 h), an inducer of aggresome formation. Representative example is shown. The results were presented as histogram overlays. (d and e) NB4 cells were transduced with control shRNA, p62#1 shRNA, or p62#2 shRNA and treated with 1 μM ATRA for 4 days. NB4 cells treated with 1 μM ATRA for 4 days and in the presence and absence of 10-nM Bafilomycin A1. (d) Representative immunoblot of Triton X-100-insoluble protein fractions for ubiquitinated-protein aggregates is shown. Quantification of ubiquitinated aggregates proteins are indicated. Results were means of two independent experiments and were expressed as the ratio of ubiquitinated aggregates proteins in ATRA-treated cells to that in untreated control shRNA NB4 cells (left panel) or untreated NB4 cells (right panel). (e) The levels of aggresomes were determined by the Proteostat aggresome detection kit following FACS analysis. The results were scored as the ratio of MFI of flow cytometery histogram in ATRA-treated cells to that in untreated cells. Values are means±S.D. (n=3). *P<0.05; ***P<0.001

