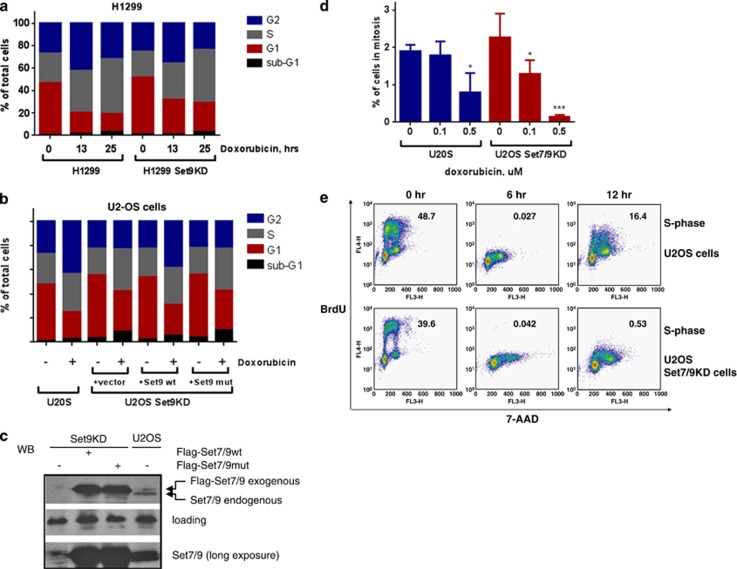
Figure 1.
Set7/9 affects cell-cycle distribution of tumour cells upon DNA damage. (a) Human H1299 lung adenocarcinoma cells stably expressing shRNA against Set7/9 or control shRNA were treated with doxorubicin for the indicated periods of time. The resulting cells were fixed, stained with propidium iodide and analysed for cell-cycle distribution. (b) Human osteosarcoma U2-OS cells were treated or non-treated with 0.5 μM doxorubicin for 14 h and analysed for cell-cycle distribution as described above. In parallel, U2-OS stably expressing shRNA against Set7/9 (U2OS Set9KD) were transfected with an empty vector, or the one expressing Set7/9wt, or Set7/9 mut (H293A). Transfected cells were treated as control U2OS cells and subjected to cell-cycle analysis. Statistical analysis was done by one-way ANOVA. All treated samples were compared with the untreated ones. Also, U2-OS Set7/9KD cells were compared with U2-OS control cells at 0 time point. Abbreviations: *P<0.05, **P<0.01, ***P<0.001; ****P<0.0001. (c) Western blot analysis of ectopic expression of Set7/9 wild-type and H279A mutant in U2-OS Set7/9KD cells. Levels of endogenous Set7/9 in non-transfected U2-OS and U2-OS Set7/9KD cells are also shown. Actin served as a loading control. (d) U2-OS cells expressing control or Set7/9-specific shRNA were pulse-treated with the indicated amounts of doxorubicin for 2 h followed by incubation for 16, 24, and 48 h. At each time point the number of mitotic cells was determined for both cell lines using phospho-S10-H3 staining. The total number of cells was also calculated. The percentage of mitotic cells was calculated as an average of mitotic cells obtained for each time point divided by the total number of cells in each case. (e) U2-OS control (U2OS cells) and U2-OS cells expressing shRNA-Set7/9 (U2OS Set9KD cells) were treated with 0.5 μM doxorubicin for the indicated times followed by labelling with BrdU. Subsequently, cells were permeabilised, treated with DNAse, stained with anti-BrdU antibodies conjugated to FITS, followed by staining with 7-AAD to visualise DNA. The resulting samples were analysed by FACS. The numbers shown indicate the percentage of cells in S phase

