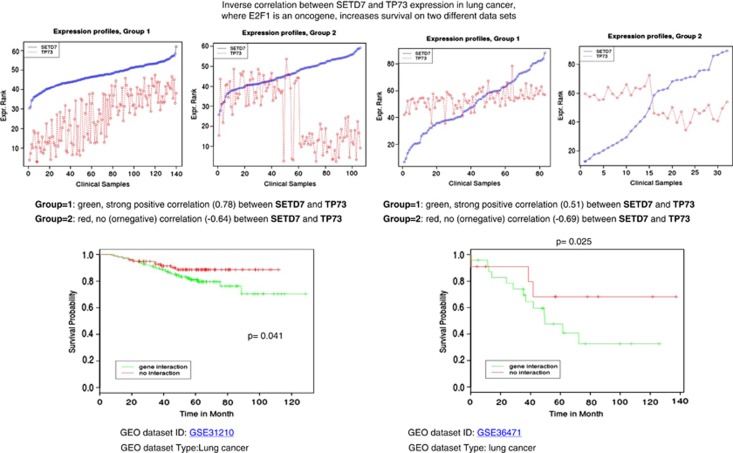
Figure 5.
Inverse correlation between Set7/9 and TP73 expression, as judged from two lung cancer data sets (GSE31210, left and GSE36471, right), increases survival of patients. A statistical procedure was implemented to divide the patients with lung cancer into two cohorts. The first one (Expression profiles, Group 1) was enriched with the positive correlation between expression levels of Set7/9 (blue dots) and TP73 (red dots). The second group of patients with negative correlation (Expression Profiles, Group 2) formed the second cohort. The number of clinical samples for each group is indicated below. To identify statistical differences in survival outcome between these two groups (lower panel), the R statistical package was used to perform statistical tests and to derive the P-value (shown inside). The Y axis denotes relative survival probability. The X axis denotes the time of survival in months. Vertical bars on the graph curves indicate the survival measurements. A strong positive correlation between Set7/9 and TP73 (green line) shows poor survival outcome compared with the negative correlation between these two genes (red line)

