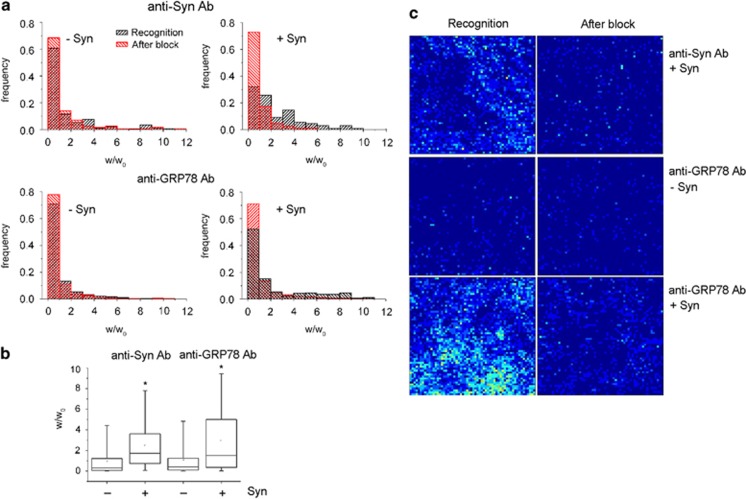
Figure 5.
Clustering of Syn and GRP78 in microdomains on the external leaflet of the neuronal plasma membrane. (a) Distribution of the normalized detachment work (w/w0) in AFM assays (colloidal probe, Ø 4 μm) performed in 10 DIV cortical neurons in the absence (left graphs) or presence (right graphs) of 5 μM wt Syn. Neurons were incubated with anti-Syn monoclonal antibody (upper graphs) or anti-GRP78 polyclonal antibody (lower graphs), followed by a rabbit anti-mouse or anti-goat secondary antibody, respectively (black). After the measurement, an excess of secondary antibody was delivered to the same sample to test for unspecific binding (red). (b) Quantification of w/w0 in samples as in a, normalized for w/w0 measured after block. (c) Pseudocolor bi-dimensional maps representing the number of recognition events obtained with a sharp functionalized AFM tip, during recognition in the presence of a species-specific secondary antibody (left panels) and after the block due to an excess of secondary antibody (right panels) (3600 force/distance curves, acquired on a 3 × 3 μm2 neuronal surface area). Maps were obtained in the presence or absence of 5 μM wt Syn; in the figure, the specific binding of Syn (first row) and of GRP78 (third row) to the cell-surface of neurons is indicated by the increase in green–yellow pixels, clustered in discrete domains. In b, -Syn anti-Syn Ab, n=174;+Syn anti-Syn Ab, n=198; -Syn anti-GRP78 Ab, n= 269; +Syn anti-GRP78 Ab, n=301. Statistical significance was determined by one-way ANOVA followed by Dunnett's test for multiple comparison, *P< 0.05

