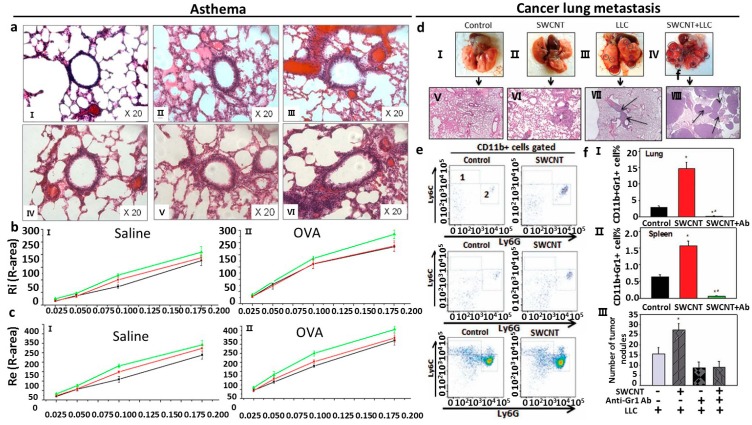
Figure 2.
(a) Lung section of mice from saline treatment plus 0 mg/mL nano-SiO2 exposure (I), saline treatment plus 40 mg/mL nano-SiO2 exposure (II), saline treatment plus 80 mg/mL nano-SiO2 exposure (III), OVA treatment plus 0 mg/ml nano-SiO2 exposure (IV), OVA treatment plus 40 mg/mL nano-SiO2 exposure (V), OVA treatment plus 80 mg/mL nano-SiO2 exposure (VI) [29]; (b) Ri of saline groups (I) and OVA groups (II) [29]; (c) Re of saline groups (I) and OVA groups (II) [29]; (d) Visualization of the lungs with tumor nodules (cricled) from different groups (I–IV) and histological images of the lung sections (×100) with micrometastases (arrows) from different groups (V–VII) [35]; (e) FACS analysis of monocytic CD11b+Ly6GnegLy6Chigh (area 1) and granulocytic CD11b+Ly6G+Ly6Clow/neg (area 2) MDSC in the lymphoid tissues and lungs in tumor-free mice 48 h after SWCNT (80 μg/mouse) or PBS (control group) pharyngeal aspiration [35]; (f) Analysis of CD11b+Gr-1+ MDSC in tumor-free C57BL6/J mice 48 h after SWCNT (80 μg/mouse) pharyngeal aspiration. * p < 0.05 versus Control group; ** p < 0.0025 versus Control group (One-way ANOVA) [35].

