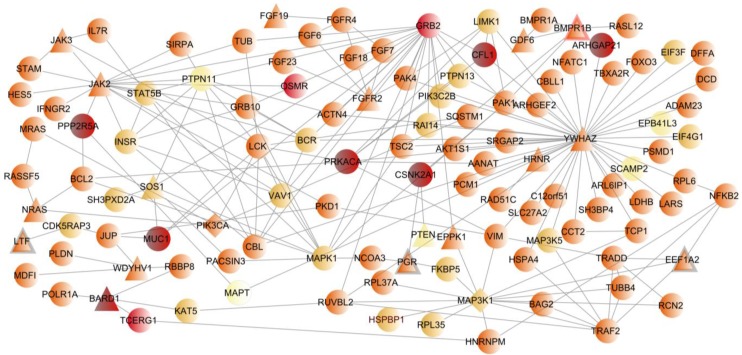
Figure 4.
Breast cancer network. This network illustrates the 19 known breast cancer genes included in the breast cancer LCC and their first neighbors. Nodes are colored based on a score reflecting their presence in an additional LCC cancer dataset (neuroblastoma) and in the LCCs for the four unrelated diseases. A darker color represents a higher score, which means a higher specificity for cancer. The shape of the node reflects the presence of each gene in breast cancer gene lists (genes associated with breast cancer in NextBio, genes with somatic mutations, copy number abnormalities or differential expression obtained from COSMIC database and TCGA data portal). Circular nodes are proteins absent from the four lists, triangular nodes are proteins present in one and diamond nodes in two. A thicker border indicates that the gene was reported to be differentially expressed in breast cancer.

