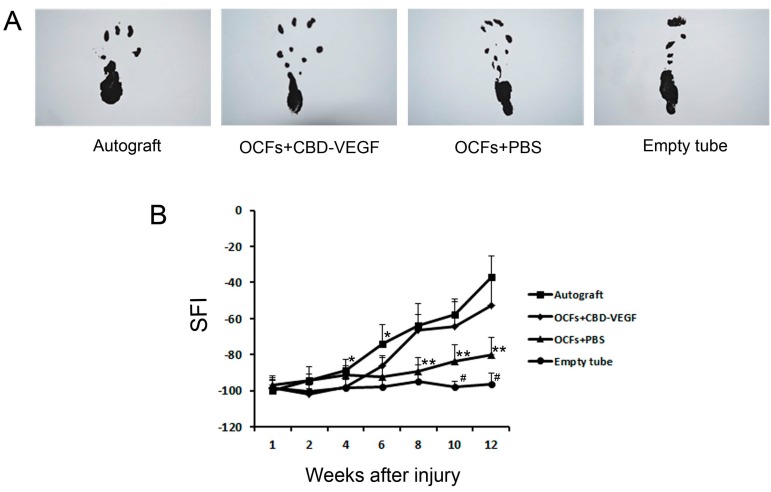
Figure 2.
Walking track analysis. (A) Photographs of the rat prints on the injured side in the four groups at week 12; and (B) The sciatic function index (SFI) values of rats in the three grafted groups and the autograft group. Data are expressed as mean±SD, n = 5, # p < 0.05, OCFs + PBS group vs. empty tube group; * p < 0.05, ** p < 0.01, (OCFs + PBS group, autograft group) vs. OCFs + CBD-VEGF group.

