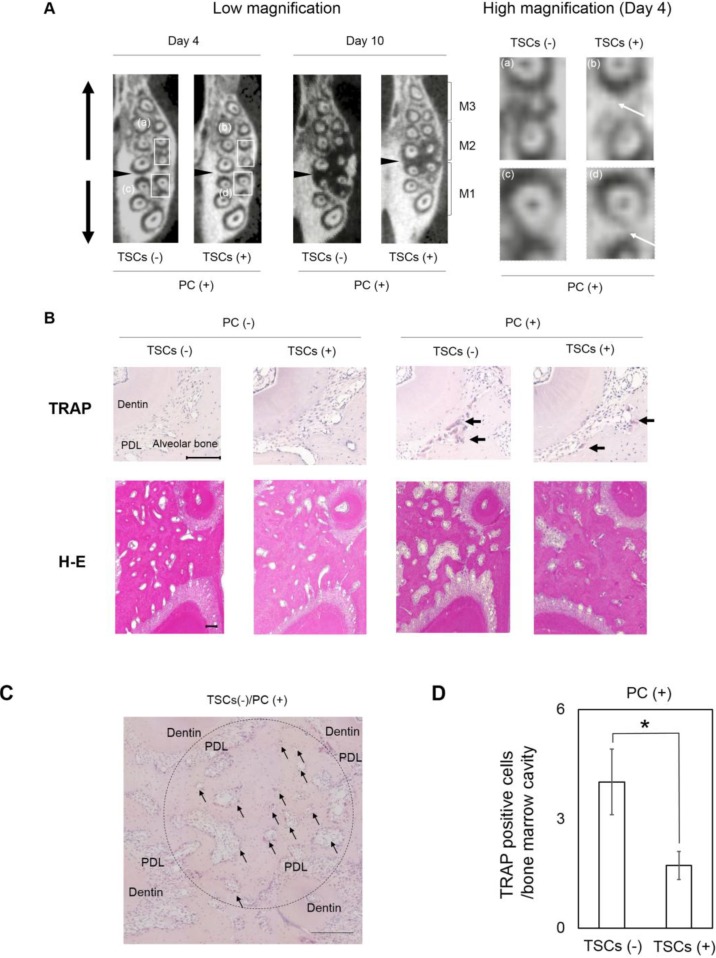
Figure 4.
The effects of the tobacco smoke components (TSCs) on bone structure. PC: power chain. (A) μCT image of maxillary alveolar bone obtained from axial view. Black arrowheads: PC insertion site. M1: first molar. M2: second molar. M3: third molar. TSC administration impaired the decreased radiopacity induced by PC insertion (white arrows at high magnification). Square (a–d): magnified area; (B) Representative histological sections stained with TRAP and H&E. Scale Bar: 100 μm. TRAP-stained sections represent areas adjacent to the distal root of M1. Black arrows: TRAP-positive cells. H&E-stained sections represent areas of the interradicular septum under M1. PDL: periodontal ligament; (C) Representative TRAP-staining of interradicular septum under M1. Round area (ϕ 900 µm) was used to quantify TRAP positive cells in bone marrow cavity two-dimensionally isolated from PDL. Scale Bar: 200 µm. Black arrows: representative bone marrow cavities used for the quantification; (D) Quantitative data for the number of TRAP-positive cells in each bone marrow cavity. Data show mean ± s.d. * p < 0.05 (Student’s t-test). Overall, 51 and 76 cavities for TSCs (−) and TSCs (+) were evaluated for each group.

