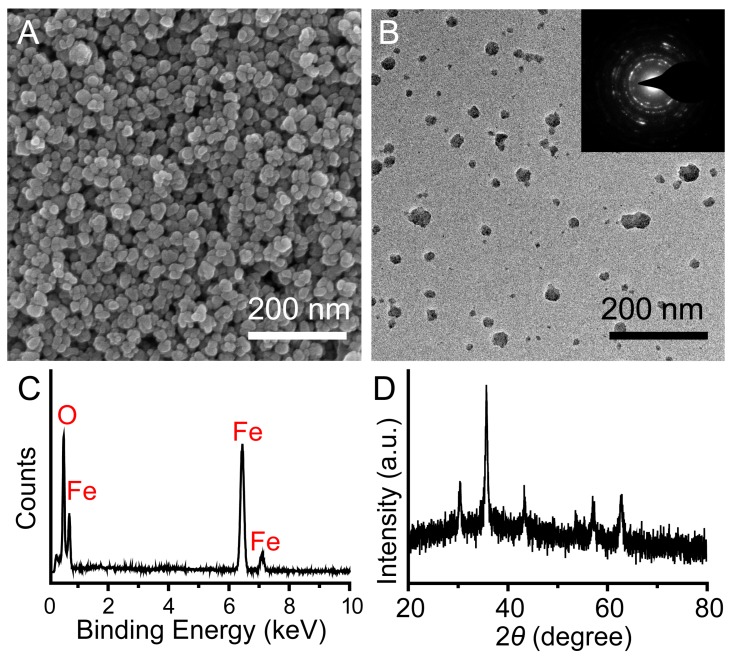
Figure 2.
Scanning electron microscope (SEM) image (A); transmission electron microscope (TEM) image (B); selective area electronic diffraction (SAED) image (inset of (B)), energy-dispersive spectroscopy (EDS) spectrum (C); and wide-angle X-ray diffraction (XRD) pattern (D) of well-prepared PEG–Fe3O4.

