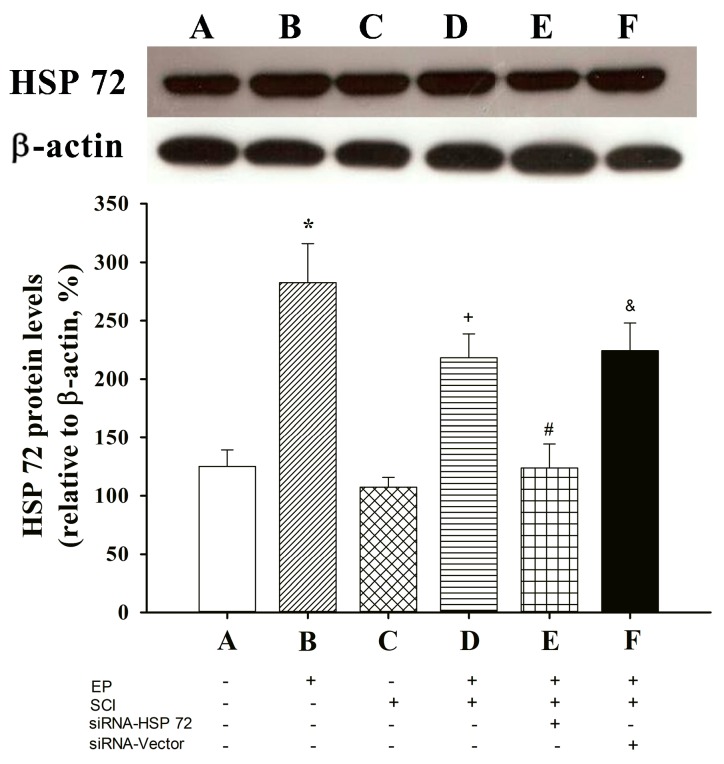
Figure 1.
Effect of exercise on spinal cord expression of HSP 72 in different groups of rats. A: EP− control; B: EP+ control; C: EP− + SCI; D: EP+ + SCI; E: EP+ + siRNA-HSP 72 + SCI; F: EP+ + siRNA-Vector + SCI. Please see Experimental groups and procedures for the explanations of the abbreviations. Spinal cord expression of HSP 72 was assessed by western blot analysis seven days after injury or sham operation. The gels presented are representative of results from three separate experiments. Densitometry readings of gel bands expressed as arbitrary units of relative intensities to that of non-Exe + sham control. Values represent mean ± SD of three separate experiments. * p < 0.01 for B or D vs. A or C; + p < 0.05 for D vs. C; # p < 0.05 E vs. D; & p < 0.05 for F vs. E.

